How to use Google Trends for keyword research when AI search changes the questions buyers ask
A keyword report can look settled right up until buyer language changes underneath it. One month, people search for broad advice about AI tools. A few weeks later, the more revealing questions appear: “Can I trust this answer?”, “Why can’t Google crawl this page?”, or “Why did impressions rise while traffic fell?” Standard volume estimates often take time to reflect that pivot.
That delay creates a planning problem. Content teams can keep publishing pages that match last quarter’s vocabulary, or they can notice when searchers start asking more urgent, specific questions. I’ve found that Google Trends for keyword research is most useful in that second scenario. It helps you see motion before the monthly-volume view looks dramatic enough to command attention.
The tool won’t tell you how many conversions a phrase will produce. It can’t replace a keyword database, either. What it can do is show that a question has started moving, that a familiar topic is being framed differently, or that a once-obscure concern is turning into a recurring research task.
For content strategists and brand marketers, that’s the useful signal. The aim isn’t to publish for every spike. It’s to detect changing demand, connect it to an existing topic cluster, and write the page your audience will soon need.
Why keyword snapshots can miss the early signal
Most keyword platforms work from modeled volume data. That makes them useful for comparing established topics, estimating demand, and finding phrases with a durable search history. Yet the model can feel slow when a product update, a new search feature, or a wave of internal buyer anxiety changes the wording people use.
AI-related research has made this gap obvious. A team may first see people asking broad questions about generative AI. Then the language gets sharper. Searchers start looking for methods to verify answers before sharing them with colleagues, ways to inspect client-side content, or reporting approaches that make sense when people get answers without visiting a site.
Those searches don’t always arrive as one giant breakout term. More often, they emerge as a pattern of neighboring questions. A single phrase may look small. Four related phrases rising over the same period deserve a closer look.
Google Trends is built for this kind of directional read. Its chart values are normalized from 0 to 100 within the selected time and location, rather than raw query counts, as Google explains in its guidance on how Trends data is adjusted and scaled. A score of 100 marks peak interest in that comparison, not “100 searches.”
That distinction matters. Don’t tell a leadership team that a term with a score of 75 has three-quarters of some fixed search volume. Say what the chart actually supports: interest is rising relative to its own peak, and the rise is stronger or weaker than adjacent terms. Different claim. Better decision.
What Google Trends for keyword research can reveal that keyword tools miss
Volume estimation answers, “How much established demand is associated with this phrase?” Trend data answers, “Is the way people frame this topic changing right now?” Both matter, but they guide different editorial calls.
Definition: Google Trends for keyword research means using relative search-interest patterns, comparisons, related queries, and time filters to judge whether a topic or question is gaining momentum. It is a directional research layer, not a traffic forecast. Use it to choose what to investigate and publish next.
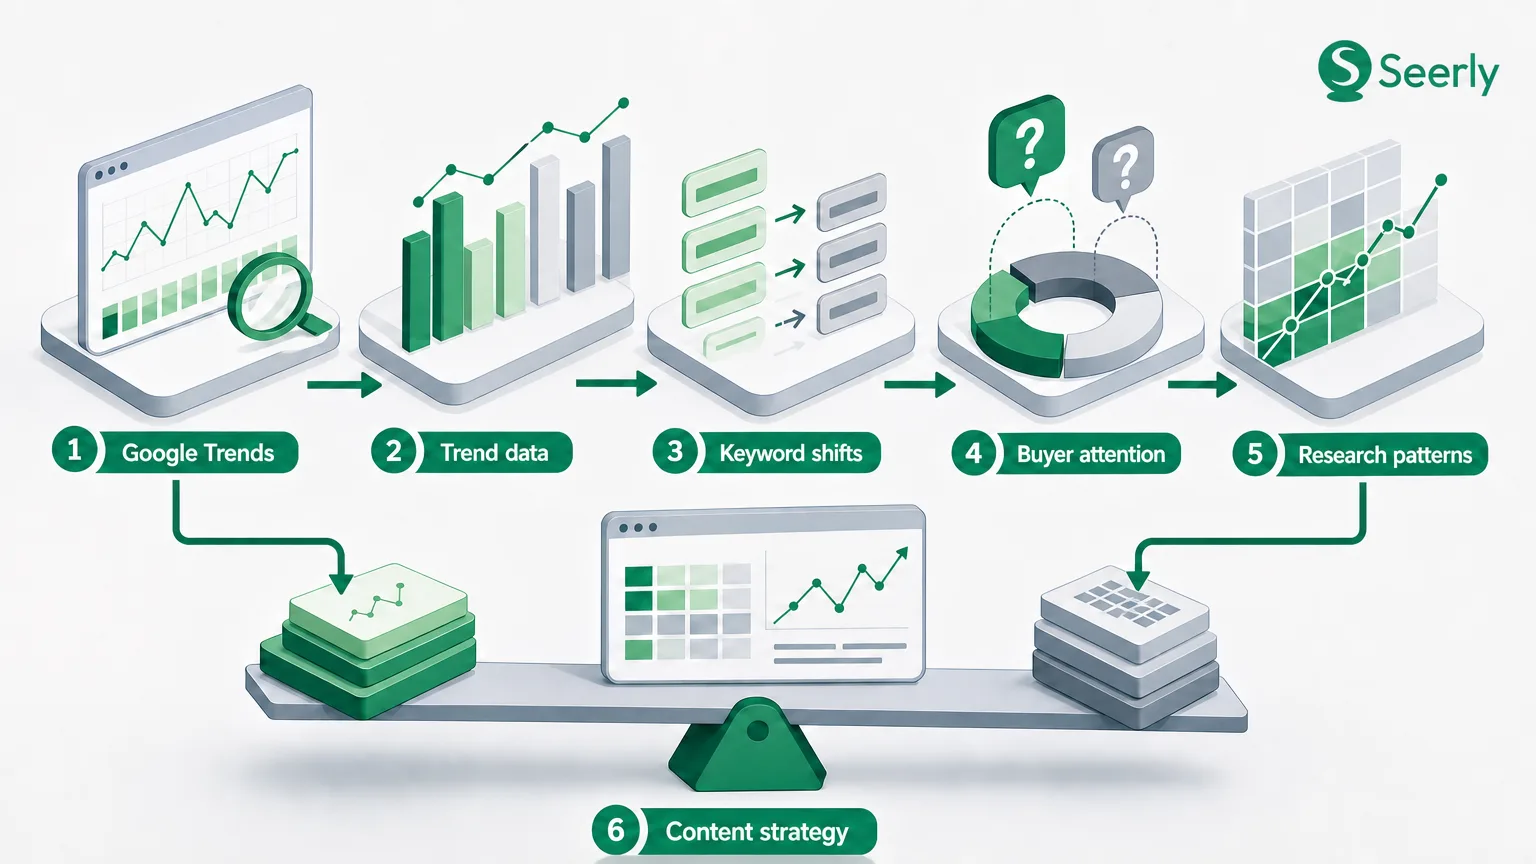
The first useful clue is acceleration. A flat topic with a seasonal bump needs different treatment from a phrase that has climbed over several weeks and stays elevated. A term rising alongside closely related questions often points to a real shift in buyer attention. One viral-news blip, on the other hand, can disappear before your draft gets through review.
The second clue is language drift. A core keyword may remain stable while modifiers shift from “what is” to “how do I check,” “why is,” or “vs.” That change tells you something about intent. Searchers may have moved from awareness into evaluation, troubleshooting, or internal justification.
Then there’s comparison. Google Trends lets you place terms on the same chart and filter by geography, timeframe, category, and search type. Google’s own documentation notes that comparisons work best when terms share the same selected conditions. Don’t compare a worldwide five-year web-search chart with a U.S. 90-day YouTube-search chart and call it a finding. That’s spreadsheet theater.
The way I see it, a keyword tool gives you the map. Trends tells you where people may have started taking a new road.
A repeatable workflow for turning trend shifts into briefs
Start with a topic you already care about. Don’t open Trends and type random phrases until a chart looks exciting. That habit produces a queue full of clever but disconnected article ideas, which is how editorial calendars become junk drawers.
Use a priority cluster instead. If your team tracks themes around trustworthy AI information, page crawlability, or search reporting, begin there. Teams that need a more orderly cluster structure can borrow ideas from Seerly’s guide to grouping related queries with keyword clustering, then keep that cluster list beside the Trends tab.
-
Choose one core topic and set the frame.
Search a broad seed phrase, then choose a timeframe that matches your decision. A 90-day view works for early motion; a five-year view helps separate a seasonal return from a genuinely new pattern. Fix the country, category, and search type before interpreting the line, because a change in settings can change the story. -
Compare rising terms against the familiar phrase.
Add two or four terms that represent different ways a buyer might state the same concern. Put a broad concept beside a practical question, then see which one has the sharper recent climb. Google says Trends supports comparisons across search terms and topics, and the “topic” option can reduce the risk of missing language variants. -
Read related queries and related topics like a researcher, not a scavenger.
Look for repeated modifiers, recurring brands, and question words that reveal the job behind the search. “Breakout” can be eye-catching, but Google defines it as a very large percentage increase, often because the earlier baseline was tiny, in its explanation of rising and breakout related searches. A breakout label starts investigation. It does not approve a content project. -
Map the signal back to an existing cluster.
Ask where the new question belongs. Does it deepen a current guide? Does it call for a comparison page? Or does it need a short social post that tests the wording before a bigger investment? A rising term without a home in your information architecture often becomes an orphaned page. -
Choose the format based on the buyer’s next move.
Publish a blog post when readers need explanation, evidence, and a repeatable method. Write a comparison page when the pattern contains “versus,” “alternative,” or evaluation language. Use a social asset when the point is timely but still unproven, then watch whether the conversation keeps returning. -
Write a measurement note into the brief before drafting.
Record the baseline: search-interest direction, current page impressions, branded mentions, referral visits, and any answer-surface appearance you track. Then state what would count as evidence after publication. Otherwise, six weeks later, the team will remember the enthusiasm and forget the original hypothesis. Happens all the time.
Three examples: from a chart to a publishable angle
Validating AI answers before sharing them internally
Say a content lead notices rising interest around checking AI-generated information, source verification, and errors in AI answers. The broad term “AI accuracy” may be noisy, while the related questions show a more useful pattern: people want a practical internal review method before they forward a summary to a client or executive.
The publishable angle is not “AI is unreliable.” That’s too broad and too easy to write badly. A stronger brief would target the specific job: “A five-step review process for checking AI answers before they enter a client deck.” The page could cover source tracing, date checks, unsupported claims, and subject-matter review.
What would you measure? Track the page’s impressions for verification-oriented queries, the language people use in form submissions, and whether the page appears where answer-style search results surface. Seerly’s discussion of trust signals marketers should measure in Google AI search can help frame that reporting without reducing the result to clicks alone.
Diagnosing JavaScript crawlability questions
Now take crawlability. A team may have a well-performing explainer on technical site discovery, yet Trends starts surfacing queries around JavaScript rendering, content missing from search, and client-side pages not appearing. The urgency is different. Searchers aren’t studying theory. They’re trying to find the breakage.
A comparison chart can help distinguish a temporary framework-related spike from a growing diagnostic theme. Look for several connected phrases that climb together over multiple weeks. Then check whether the questions point toward the same underlying task: testing what a crawler can actually see versus what a browser renders.
That pattern deserves a troubleshooting article or an engineering-facing checklist, not a vague thought-leadership post. Build the brief around observable steps: inspect rendered HTML, compare source output with visible content, confirm links exist without user interaction, and document the fix. Keep the tone calm. Technical readers are often arriving after a stressful discovery.
Reporting when answers reduce clicks
The third example starts with a frustrating dashboard moment. Impressions are up. Average position may look fine. Traffic is flat or down. Someone asks whether search has stopped working, which is a reasonable question, even if the answer is messier than anyone wants.
Trend research may reveal rising language around “zero-click searches,” AI summaries, answer visibility, or measuring brand appearance in generated results. Rather than publishing another generic analytics article, shape the content around the reporting problem: “How to explain rising search presence when fewer people visit the site.”
The brief should compare metrics that answer different questions: search impressions, visits, assisted conversions, branded search demand, and tracked appearances in answer formats. For a practical reporting companion, see Seerly’s piece on measuring Google AI search before hiring a specialist. The point isn’t to declare traffic irrelevant. It’s to stop treating one metric as the whole story.
How to avoid chasing noise
A steep chart can make almost any idea feel urgent. Resist that feeling. Editorial teams have limited research time, subject-matter access, and publishing slots. A topic needs more than movement before it earns one of them.
Run each candidate through this checklist:
-
Business relevance: Can the topic connect to a real customer question, product concern, or brand position? If the answer requires three awkward leaps, leave it alone. Interest without relevance produces content that attracts the wrong conversation.
-
Audience fit: Would a person you want to reach recognize the problem immediately? Read the related queries aloud. If they sound like consumer curiosity while your readers need operational guidance, the topic may suit a different publisher.
-
Repeatability: Does the signal recur across weeks, locations, or adjacent phrases? One day of news attention can still justify a quick post, but it rarely justifies a large cornerstone page. Look for a pattern with legs.
-
Evidence: Can your team support the answer with documentation, screenshots, expert review, or original observations? A rising question without a defensible answer is a trap. The internet has enough thin takes already.
-
Content gap: Search your existing library before assigning a new URL. Sometimes the better decision is refreshing an older article, adding a new section, or creating a short supporting asset that points to the deeper page.
Honestly, I think the evidence filter does the most work here. Trends can tell you that people are asking. Your team still has to earn the right to answer.
Questions teams ask about Google Trends
How often should we review trends?
Review priority clusters monthly, then check weekly when a fast-moving product change or industry event affects your audience. Monthly reviews keep the practice tied to editorial planning rather than daily chart watching. A short weekly check can catch sudden question shifts, but only if someone has authority to act on them.
Does Google Trends replace keyword tools?
No. Google Trends does not supply the raw-volume estimate, difficulty model, ranking history, or competitor data that many planning decisions need. Pair it with your regular keyword research process, and treat it as a directional signal that helps you decide where to investigate further.
How should we report after publication?
Start with the hypothesis in the content brief, then compare performance against the baseline you recorded. Watch search impressions, traffic quality, query wording, conversions where relevant, and appearances in answer-oriented results. Give the page enough time to collect evidence, then update the brief with what changed and what didn’t.
Turn the monthly review into a publishing habit
Build a monthly trend review around your highest-priority keyword clusters. Keep it short: one hour to compare core terms, read related questions, flag repeat signals, and reject the noise. A disciplined “no” list is part of the process.
For each pattern that survives, create a focused brief with one audience question, one page format, one evidence plan, and a measurement baseline. Track whether your content earns credible source mentions, appears in answer experiences, and contributes to downstream traffic rather than judging it on a single click chart.
The interesting question isn’t whether search behavior will keep changing. It will. The useful question is whether your next editorial decision will reflect the questions buyers started asking last month, or the ones they stopped asking six months ago.
Learn more at Seerly.