The AI visibility reporting data dictionary every agency needs
Two teams can look at the same brand on the same afternoon and publish wildly different AI visibility reporting results. One report might say the brand has “60% visibility” because it appeared in six of 10 answers. Another might report “20% visibility” because the brand’s own site appeared as a cited source in only two answers.
Neither team has to be wrong. They may simply be counting different events.
That distinction matters because AI-powered search is changing how people encounter brands before they visit a website. In Pew Research Center’s analysis of Google browsing behavior, users were less likely to click a traditional result when an AI summary appeared. A report that only tracks clicks can miss what happened earlier: Was the brand named? Was it accurately described? Did its pages support the answer?
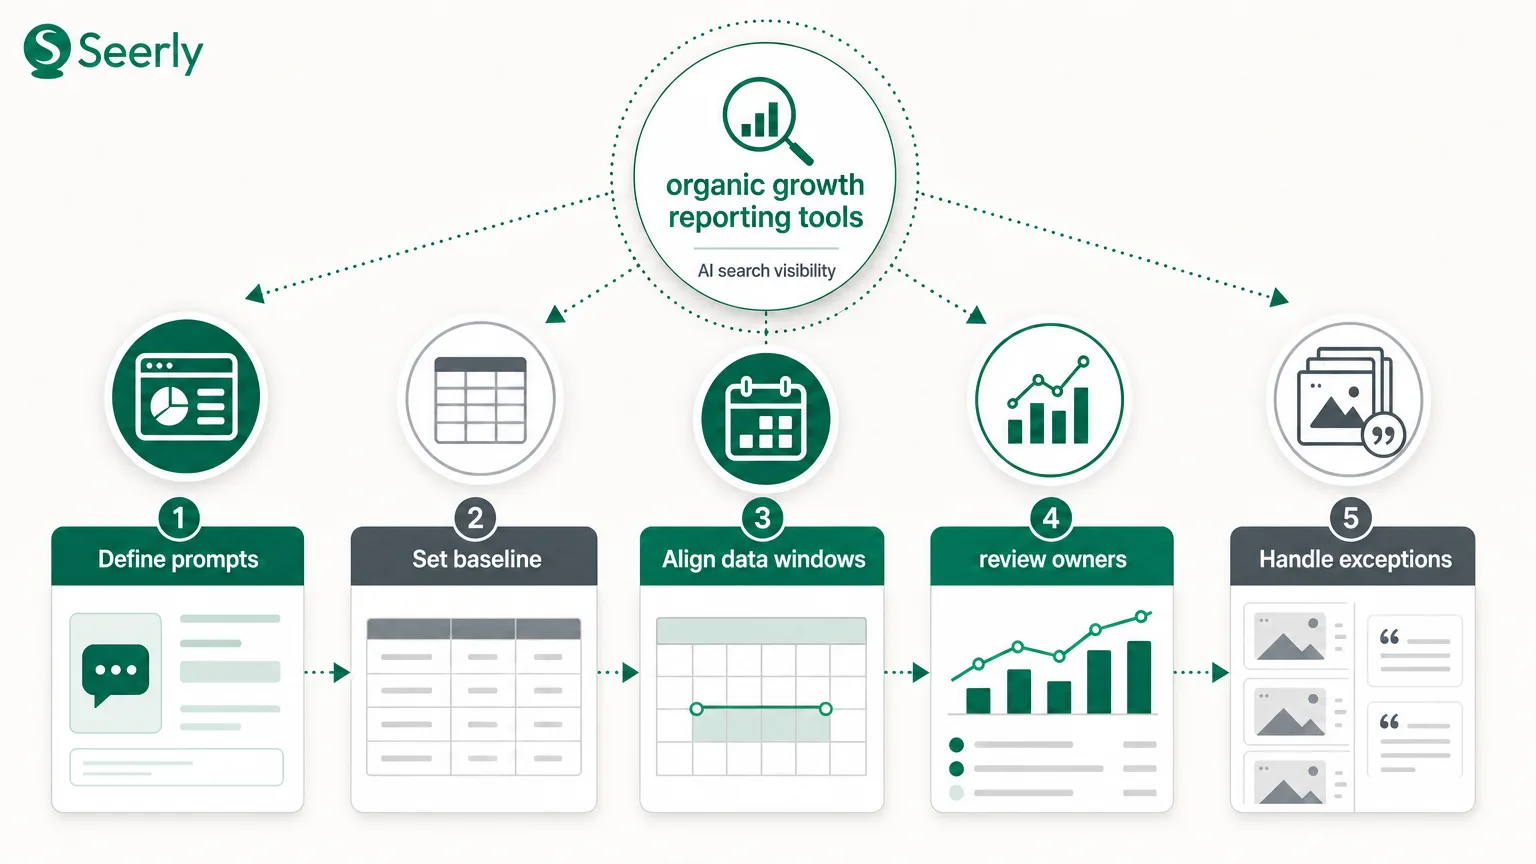
Agencies need a shared language before they need another chart. The useful unit of reporting isn’t a vague score. It’s a documented observation: what prompt ran, where it ran, when it ran, what appeared, and what the team plans to do next.
AI visibility reporting is the practice of recording and interpreting how a brand, its owned sources, and its competitors appear in a defined set of AI-generated answers over time.
Here’s the data dictionary and operating rhythm I’d put in place before the next client review.
Why similar AI visibility reports conflict
Start with a plain example. An agency runs “best project management software for a 30-person marketing team” once and sees a client named in the answer. It marks the prompt as a win. An in-house team runs a set of 40 prompts across two providers and finds the client named in 12 answers, while the client’s domain appears as an answer source in only four.
Both teams may label their metric “brand visibility.” Trouble starts when that label reaches a leadership slide without its definition.
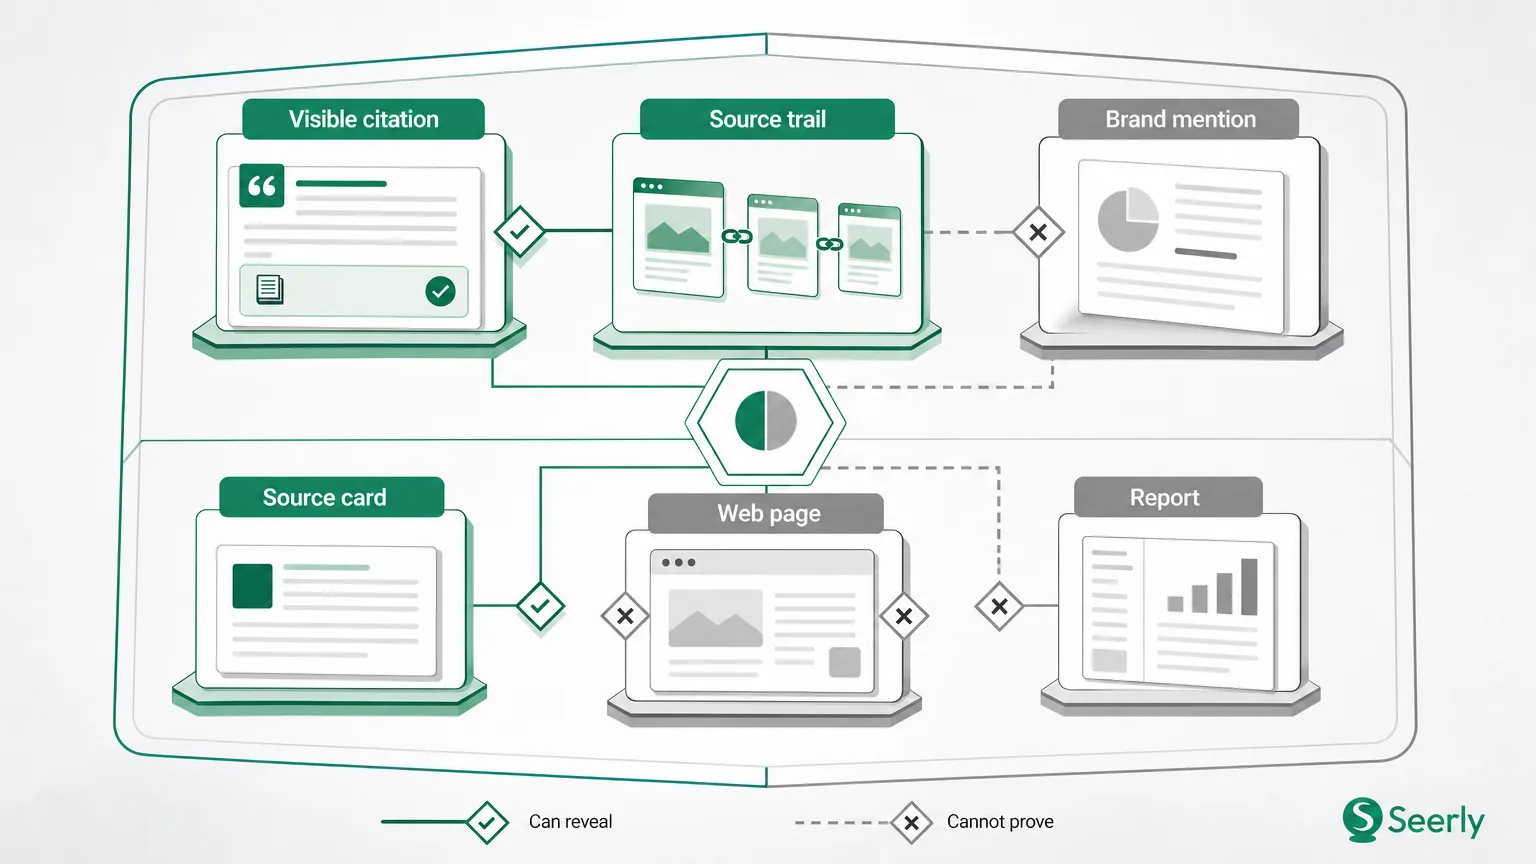
Answer presence asks, “Did the answer mention the brand?” Source presence asks, “Did the system link, cite, or otherwise name an owned domain as support?” Those observations overlap sometimes. They do not mean the same thing. A publication, comparison site, or forum thread may support a favorable brand mention without the brand’s website appearing at all.
Prompt scope creates another mismatch. A single prompt run can be a useful diagnostic, but it is not a trend. A monitored prompt set is a repeatable sample, with fixed wording and documented rules. Google also notes that AI feature traffic appears within Search Console’s existing web reporting, rather than as a detached reporting category, in its guidance on AI features in Search. That makes careful scope even more important when teams compare discovery data with site traffic.
The thing is, a polished percentage can hide a messy measurement method. Reports become comparable only when they name the event being counted and the denominator behind it.
What every AI visibility reporting metric must mean
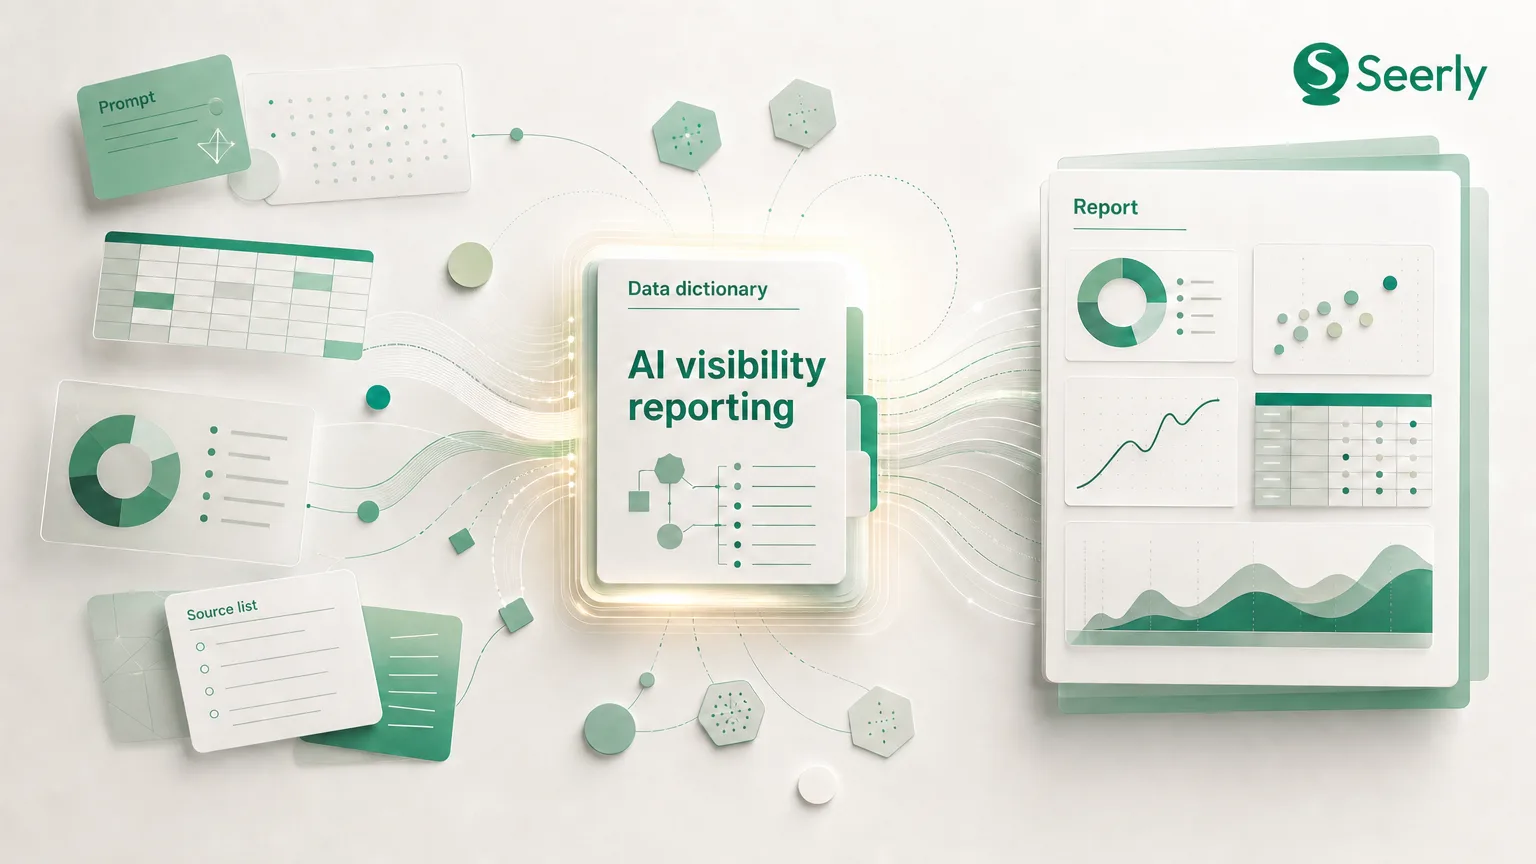
A data dictionary should fit on one page. It does not need academic ceremony. It needs enough detail that a new account manager can reproduce last month’s number without asking the person who built the spreadsheet.
Use the following template as a starting point. Assign one owner per metric. That person resolves edge cases and records any rule change before the next reporting period.
| Metric | Definition and unit of analysis | Include / exclude | Owner | Recommended action |
|---|---|---|---|---|
| Prompt coverage | Share of planned prompts successfully run. Unit: scheduled prompt run. | Include completed runs with captured evidence. Exclude failed runs and duplicate retries. | Reporting lead | Repair missing runs before interpreting trends. |
| Answer presence | Share of completed prompt runs where the brand appears in answer text. Unit: prompt-provider run. | Include direct brand names and approved product names. Exclude ambiguous words and unrelated entities with a matching name. | Brand lead | Review recurring omissions by prompt theme. |
| Citation presence | Share of runs where an owned domain appears as a linked or named supporting source. Unit: prompt-provider run. | Include approved domains and subdomains. Exclude social profiles unless the scope says otherwise. | Content lead | Check source pages, claims, and supporting evidence. |
| Citation position | Ordinal position of an owned source among visible sources. Unit: source appearance. | Include only visible source lists. Exclude answers with no ordered source display. | Analyst | Investigate repeated movement, not one-off shifts. |
| Sentiment | Coded tone of the brand mention: positive, neutral, negative, mixed, or not applicable. Unit: brand mention. | Include explicit evaluative language. Exclude neutral listings with no judgment. | Brand or comms lead | Escalate inaccurate negative claims for review. |
| Competitor presence | Share of runs naming each agreed competitor. Unit: prompt-provider run. | Include the pre-agreed competitor list. Exclude surprise entrants until the next scope review. | Strategy lead | Compare prompt themes, sources, and claims. |
| Provider coverage | Portion of planned provider-prompt combinations completed. Unit: scheduled run. | Include supported providers in the current plan. Exclude providers added mid-period from prior-period comparisons. | Operations lead | Separate provider gaps from brand changes. |
| Change period | The date range compared with a prior period of equal length and same scope. Unit: reporting period. | Include only matched prompts and providers. Exclude newly added prompts from period-over-period deltas. | Reporting lead | Flag scope changes next to every comparison. |
Two decisions deserve special care. First, define an “owned domain” list before monitoring begins: primary domain, country domains, help center, documentation, and any approved subdomains. Second, keep sentiment coding boring. If one reviewer calls “popular but expensive” positive while another calls it mixed, the monthly chart becomes a Rorschach test.
For a deeper scoring format, Seerly’s guide to building an AI visibility scorecard for leadership is useful once the raw fields have settled. Scores should summarize evidence, not replace it.
Keep the context attached to the number
Here’s a worked example. In April, a client’s answer presence falls from 55% to 35% for a software category. The account team sees the drop and drafts a recommendation to rewrite product pages. Then someone opens the run log.
The April prompt said, “What is the best UK expense management software for a remote consultancy?” March used, “Best expense management tools.” April also used a UK location assumption, a desktop browser, one named provider, and a capture taken on the 15th. March’s run had no market qualifier and used another provider. Same metric label. Different experiment.
A trustworthy record carries this context with it:
-
Prompt text and prompt ID. Keep the exact wording, including constraints such as business size, location, price range, or use case. A prompt changed by six words may ask for a different recommendation set.
-
Market and location assumptions. Record country, language, city where relevant, and whether the setting was explicitly selected or inferred. Localized intent can alter both the answer and the sources behind it.
-
Provider, interface, and device assumptions. Note the product used, account state if relevant, browser or app, and desktop or mobile view. Some interfaces display sources and answer modules differently.
-
Run date, time, and evidence captured. Save the raw answer text, source list, screenshot or export, coded fields, and reviewer name. Raw evidence is dull until a client asks why a number changed. Then it becomes the whole conversation.
I’m not 100% sure every provider will expose the same evidence forever. That’s exactly why the evidence standard has to be written down now. Teams can also use schema validation to reduce reporting risk when reports pull records from several trackers or analysts.
Which movements deserve a response?
A one-point movement on one prompt is weather. Repeated movement across a defined group may be climate. Treating both as equal creates frantic content work and little learning.
Set thresholds from the monitored set rather than borrowing a universal benchmark. Begin with three bands: watch-only, investigate, and act. A team might classify a change as watch-only when it appears in one run or lacks matching evidence in a repeat run. Investigation begins when the movement repeats across several prompts in the same theme. Action starts when the pattern persists, affects a material prompt group, and points to a plausible cause that the team can test.
Here’s a decision path that works in practice:
-
Did the movement repeat on a scheduled rerun? If no, log it and watch. Generative answers can vary, and one capture is thin evidence.
-
Did the answer contain a wrong brand fact? If yes, check the relevant owned page, structured data, public listings, and authoritative third-party references. Record the exact statement before changing anything.
-
Did source presence decline while answer presence held? Review pages that support the topic. Tighten factual detail, dates, named authorship, and source material before publishing a broad rewrite.
-
Did a competitor gain across the same prompt cluster? Compare its mentions and visible supporting sources. Don’t copy its page format blindly. Find the informational gap or claim gap.
-
Did both brand and competitors fall? Check provider coverage, prompt wording, market settings, and source display changes. The measurement system may have changed before the market did.
Content changes fit a repeated gap around a topic. Fact corrections fit a clearly false or stale statement. Citation-evidence work fits missing support for claims that answers repeat. Competitor investigation fits a sustained relative shift. Everything else can sit in the watch queue. Not glamorous. Still useful.
Turn definitions into a monthly client process
Good reporting has a cadence. It is less about producing a thicker deck and more about making decisions traceable.
At month-end, lock the prompt set and run coverage first. Next, refresh the metric glossary only if a rule changed, then write the executive summary in plain language: what moved, how broad the movement was, what evidence supports it, and what the team will do. Keep the executive summary short enough that someone can read it before a meeting without a second coffee.
Attach an evidence appendix behind the summary. Include prompt IDs, raw answer captures, source records, coding notes, completion rates, and exclusions. Put a date beside every screenshot. If the client asks why a competitor appeared in a result, the reporting team should be able to answer from the appendix rather than rerunning a prompt live and hoping the answer cooperates.
Then maintain an action register with four fields: observation, decision, owner, and follow-up date. Add the exact prompts that will test the decision next month. That last step prevents the familiar problem where a team ships new material, declares success, and later realizes it never checked the prompts that motivated the work.
For teams trying to connect this work with broader measurement, read Seerly’s AI visibility and organic traffic KPI reporting model. Keep the metrics distinct at first. Correlation can be examined later, once the observation rules stop moving around.
Frequently asked questions
Is answer presence the same as citation presence?
No. Answer presence records a brand mention in generated text. Citation presence records an owned source appearing as visible support. A brand can receive one without the other, so reports should show both fields separately.
How many prompts should a reporting set include?
Use enough prompts to cover the decisions the client needs to make, then keep that set stable. A small, well-documented set beats a huge, drifting list. Add prompts at planned scope reviews and label them as new.
Should agencies report one visibility score?
A single score can help an executive scan a report, but it should sit beside its ingredients. Publish the weighting, denominator, provider scope, and exclusions. Otherwise, a score becomes a persuasive-looking mystery number.
Start with one page
Before the next review cycle, write a one-page reporting dictionary. Assign an owner to every metric. Agree on the evidence each record must retain, then use those same rules for answer presence, source presence, sentiment, and competitor reporting.
The aim is not perfect certainty. It is a record that can survive the question, “What exactly does this number mean?” Learn more at Seerly.