A reporting model for AI visibility, organic traffic and SEO KPIs
An organic-only SEO report can look healthy while leaving a material part of discovery unexamined. It may show non-brand clicks, keyword rankings, conversions, and landing-page performance, yet say little about whether buyers encounter the brand when they ask Google AI search or answer platforms to compare solutions, research a category, or validate a short list.
That gap matters because AI-led search journeys do not always produce the same observable path as a conventional search result. In a Pew Research Center analysis of browsing data, users clicked a traditional search result on 8% of visits with an AI summary, compared with 15% of visits without one. A lower click rate does not prove that AI results harm every brand or query, but it does mean traffic alone is an incomplete proxy for buyer discovery.
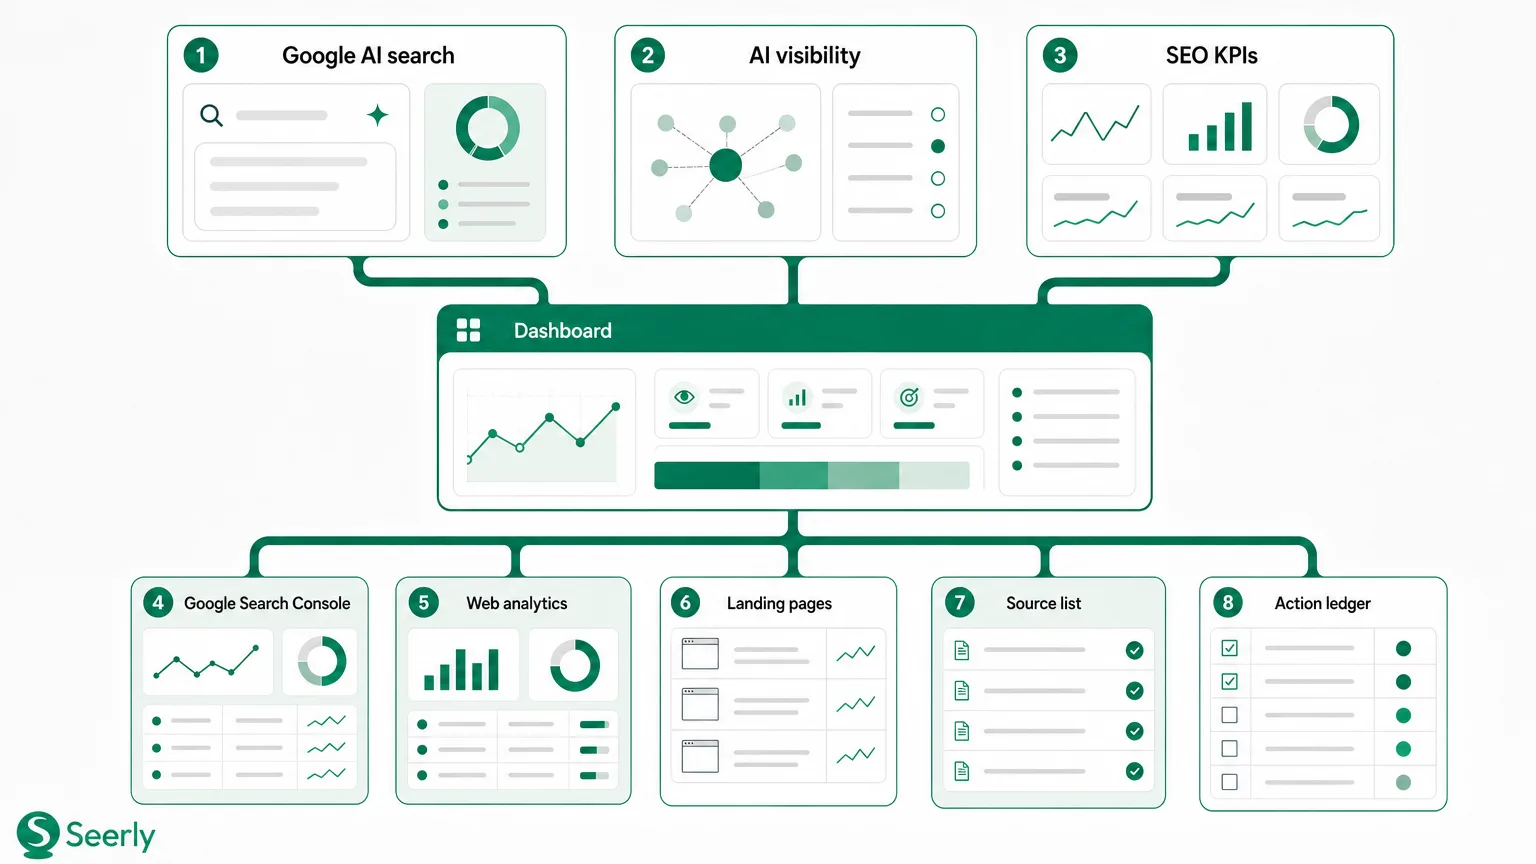
The practical goal is not to replace SEO reporting with a new visibility score. It is to create one decision-ready model that connects buyer-question visibility, citation evidence, organic performance, and accountable actions. That model helps marketing leaders distinguish between a problem with discoverability, credibility, content coverage, search demand, or conversion.
What becomes invisible when a report only shows traffic and rankings?
A conventional SEO report typically starts with sessions, clicks, impressions, average position, top keywords, and conversions. Those are essential operational measures. Google Search Console, for example, provides reporting on clicks, impressions, click-through rate, and average position, which makes it a core source for evaluating established organic search performance.
However, traffic and rankings do not show whether a brand was considered and then omitted in an AI-generated answer. They also cannot reveal whether a competitor was repeatedly named for a high-value buyer question, whether an independent source was cited instead of the brand’s own page, or whether the answer framed the category in a way that weakens the brand’s positioning. These are visibility and reputation questions before they become traffic questions.
An integrated report adds a layer for the questions buyers actually ask. Rather than treating a keyword as the entire unit of analysis, it groups queries by commercial job: selecting a platform, comparing alternatives, solving a problem, evaluating implementation risk, or validating trust. This is particularly important for long, conversational prompts where a conventional rank tracker may have limited coverage.
Organic-only reports versus integrated visibility reports
| Reporting dimension | Organic-only SEO report | Integrated visibility report |
|---|---|---|
| Primary unit | Keyword, page, session | Buyer question, answer, citation, page, session |
| Core evidence | Ranking and click data | Visibility observations plus organic data |
| Competitive view | Share of rankings and SERP positions | Which brands and sources appear in answers |
| Content diagnosis | Pages gaining or losing traffic | Questions with weak coverage, missing citations, or unreliable claims |
| Leadership decision | Where to improve rankings | Where to improve authority, content, technical access, and conversion paths |
The difference is not semantic. A team may see organic clicks decline for a category page, assume the page needs more keywords, and miss the fact that AI-led results now answer the buyer’s first question directly while citing three competing publications. Conversely, a brand could gain AI visibility for comparison questions but still fail to gain traffic because its cited page does not give visitors a clear next step.
Google’s documentation describes AI Overviews as a feature that can help users understand information more quickly and explore links across the web. For reporting purposes, that means teams should observe both exposure and downstream action. Neither should be treated as a complete measure of performance on its own.
Where can teams track AI visibility alongside organic traffic and SEO KPIs?
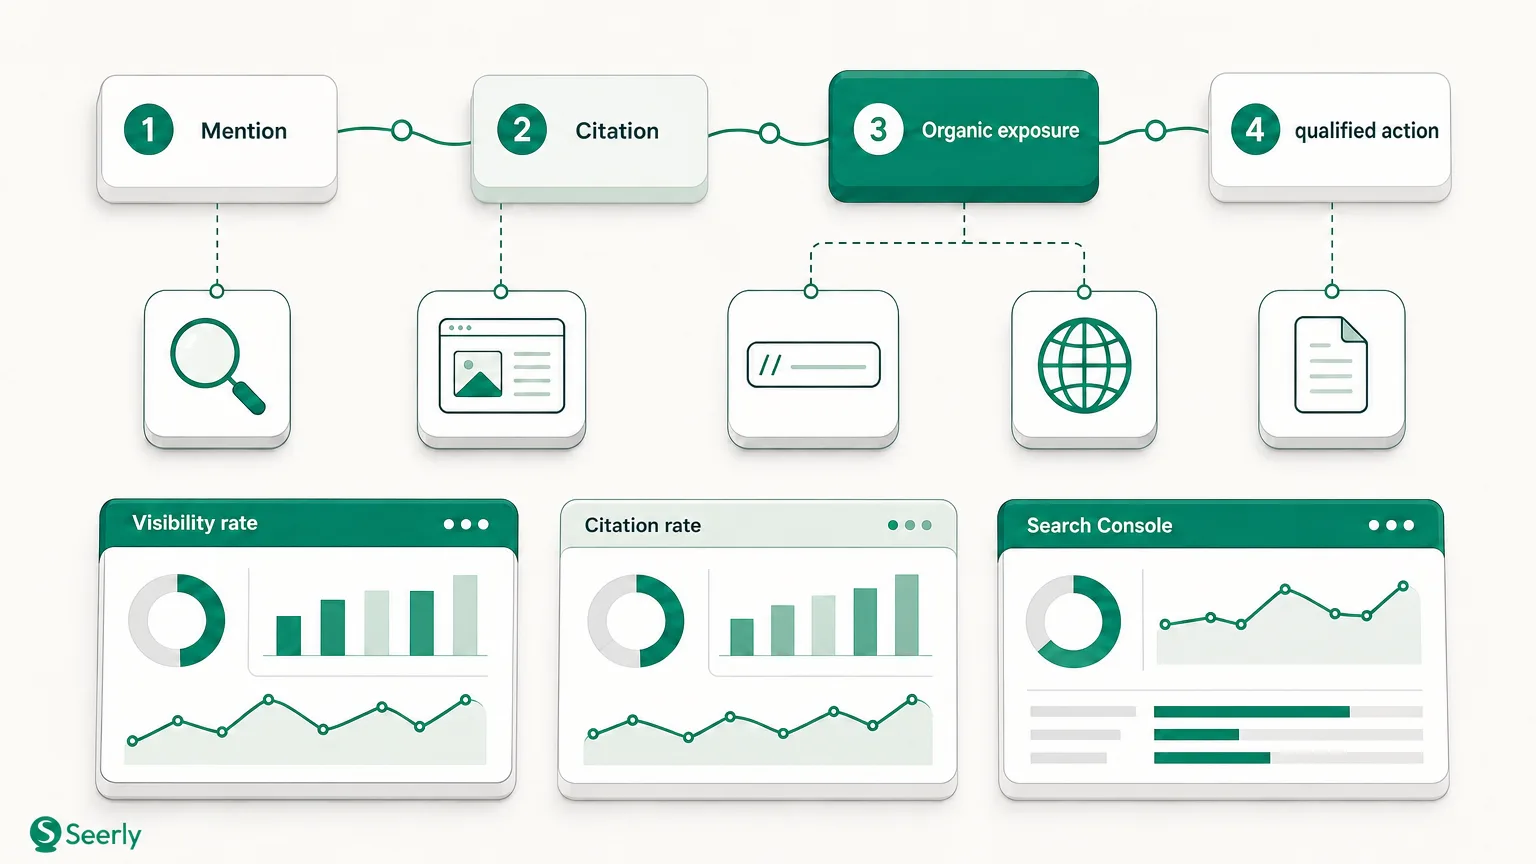
Teams can track it in a shared reporting view that combines four data layers: tracked buyer questions, AI-search observations, citation and source evidence, and their existing analytics and Search Console review. Seerly is designed to provide the AI discovery layer, while Google Search Console and web analytics remain the systems of record for organic clicks, landing-page engagement, and conversions.
The reporting view should not attempt to claim that every appearance caused a session or revenue event. Instead, it should align the data by question cluster, topic, page, market, and reporting period. This gives the team a defensible way to examine whether changes in AI visibility occur alongside changes in impressions, rankings, traffic, and commercial outcomes.
The core AI-search KPI glossary
A useful dashboard begins with defined measures. Definitions matter because “visibility” can otherwise become an attractive but ambiguous number in a leadership meeting.
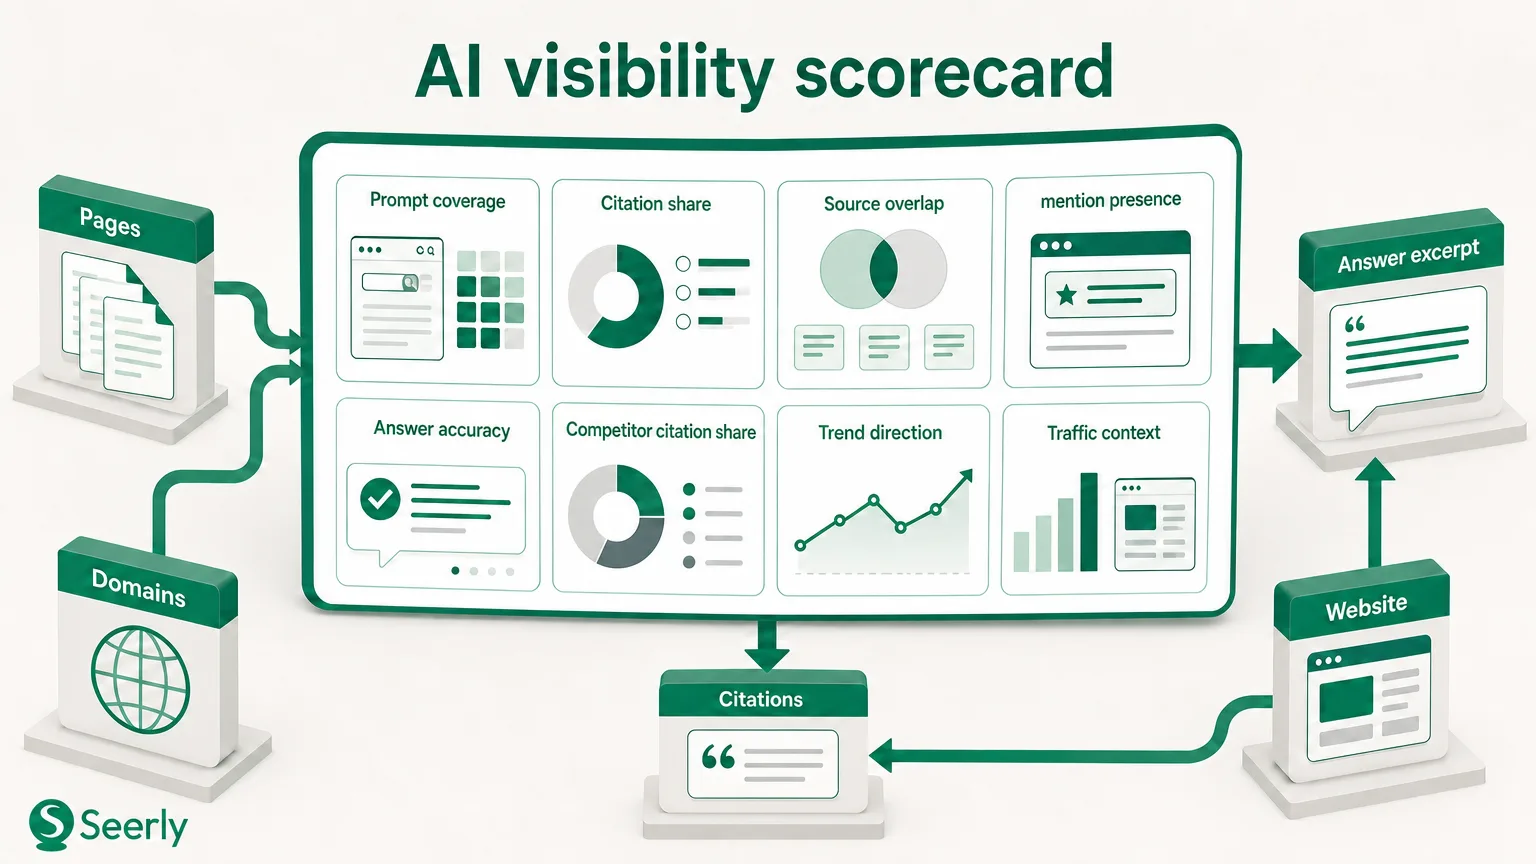
| KPI | Definition | Why it matters |
|---|---|---|
| Tracked buyer questions | A curated set of prompts and queries mapped to audience, funnel stage, and commercial priority | Keeps monitoring tied to real buying decisions rather than an arbitrary prompt list |
| AI answer appearance rate | The percentage of observed answers that mention or recommend the brand | Shows breadth of presence across the tracked question set |
| Citation rate | The percentage of observed answers that link to or cite a brand-controlled asset | Separates being mentioned from being used as supporting evidence |
| Source-quality mix | The share of citations from owned pages, third-party reviews, publishers, partners, or community sources | Reveals whether authority rests on a balanced, credible evidence base |
| Competitor appearance rate | The percentage of observations in which each competitor appears | Identifies question clusters where rivals shape the buyer’s choice |
| Organic clicks and impressions | Search Console performance for mapped queries and landing pages | Indicates conventional search demand and site visibility |
| Ranking distribution | The number of mapped keywords in priority ranking bands | Helps diagnose whether a traffic shift has a traditional ranking component |
| Conversion quality | Leads, trials, sales, or assisted conversions from mapped organic landing pages | Connects discovery work to business accountability |
Citation rate requires careful interpretation. AI systems may link to a page without strongly endorsing the brand, while a brand may be mentioned without a direct citation. Research comparing AI search engines has found substantial weaknesses in how systems cite and represent news sources, so teams should preserve the underlying answer, source list, date, and query context rather than relying only on a rolled-up percentage.
A sample dashboard layout
Place the leadership view on one page, then link to deeper working tabs. The top row should show the current month versus the prior period: AI answer appearance rate, citation rate, organic clicks, non-brand impressions, conversions, and the number of high-priority questions with no brand appearance. Add a brief interpretation beside each variance, not simply an up or down arrow.
The middle of the dashboard should organize performance by buyer-question cluster. A B2B software team, for example, might use “best platform for,” “alternative to,” “how to solve,” “integration with,” and “security requirements” clusters. For each cluster, show brand appearance, competitor appearance, cited sources, mapped landing pages, organic clicks, average position, and an owner.
The final section should be an action ledger. Every meaningful finding should lead to a named decision: update a product comparison page, improve original research, address a technical indexing issue, build a partner evidence asset, or test a clearer conversion path. A dashboard becomes operational when it connects evidence to work that can be reviewed the following month.
Pair Google AI search observations with established SEO data
Google AI search observations should be paired with organic data at the topic and question-cluster level, not forced into a false one-to-one attribution model. The Google AI search engine can present different formats depending on query context, location, device, personalization, and product changes. A reliable report therefore records repeated observations under a documented sampling method and compares directional patterns over time.
Worked example: diagnosing a comparison-topic gap
Imagine a cybersecurity company tracks 30 high-intent questions in its “vendor comparison” cluster. During April, the brand appears in 9 of 30 observed AI-led answers and receives citations in 4. Its principal competitor appears in 21 answers, often supported by independent review sites and integration documentation.
At the same time, the company’s comparison landing pages receive 18% fewer organic clicks month over month, while non-brand impressions are broadly stable and average ranking falls only modestly. The report should not state that AI answers caused the traffic decline. It can state a more useful finding: discovery evidence and organic performance both indicate that the comparison cluster needs attention, while stable impressions suggest the issue is not simply lost search demand.
The working hypothesis may be that the competitor has stronger evidence for the questions buyers use to reduce risk: implementation time, integrations, security documentation, and customer proof. The next actions could include publishing a substantiated comparison page, improving the technical clarity of integration documentation, obtaining independent validation, and updating the relevant pages’ internal links and calls to action.
In May, the team compares the same question set using the same configuration. If brand appearance rises from 30% to 47%, citations rise, and comparison-page impressions or engagement improve, that is evidence of progress. If appearances rise but organic conversions remain flat, the next decision is not “declare success”; it is to assess landing-page relevance, audience quality, and conversion friction.
Use leading and lagging indicators together
AI answer appearance and citation evidence are leading indicators of whether the brand is available to be discovered in a buyer journey. Organic impressions, clicks, rankings, and conversions are lagging indicators of established search performance and commercial response. Both are useful, but they answer different questions.
A practical monthly report labels this distinction explicitly. Use AI visibility to prioritize content and authority work; use organic and conversion metrics to assess whether the broader search program produces qualified visits and outcomes. For a deeper operating model, teams can also apply a 90-day search-performance maintenance loop to ensure findings become recurring improvements rather than isolated dashboard observations.
Compare platforms by evidence quality, not by a single score
There is no universal winner among search and answer platforms because each platform can serve different audiences, query types, markets, and reporting needs. A marketing team evaluating tools should compare them based on the decisions they need to make, not on whichever vendor offers the largest visibility number.
Google continues to evolve AI-driven search experiences, including updates to AI Mode’s capabilities and availability. That volatility makes methodological transparency especially important. Ask whether a platform preserves the actual question, answer, cited sources, date, locale, device context, and model or product context where applicable.
A practical evaluation framework
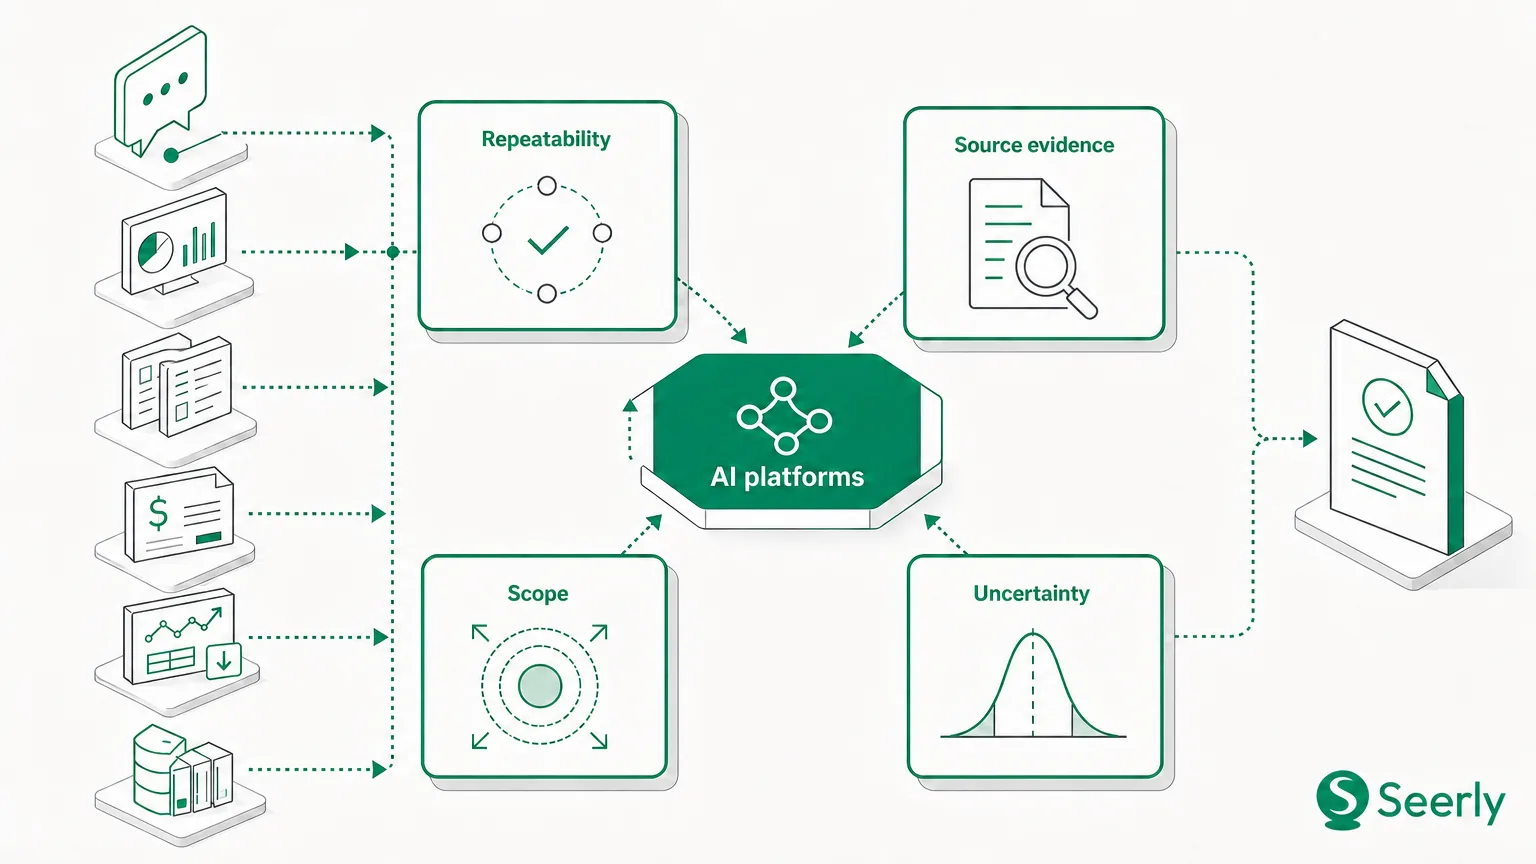
Evaluate each platform across five dimensions. First, assess question coverage: can the team track the buyer questions, categories, languages, and markets that matter? Second, assess evidence retention: can analysts inspect the response and source evidence behind the metrics?
Third, assess repeatability. A platform should make it possible to compare observations over time under a consistent method, while still disclosing when the underlying search environment changes. Fourth, assess integrations: can the AI visibility layer be aligned with Search Console, analytics, CRM outcomes, and existing SEO workflows?
Finally, assess actionability. The best reporting environment should identify which topics lack credible content, which third-party sources shape brand reputation, where competitors are repeatedly present, and who owns the next action. Teams looking to define the monitoring scope can use this framework alongside guidance on how to monitor brand presence in Google AI chats and compare it with search rankings.
Put content AI tools in the workflow without confusing them with evidence
Content AI tools can accelerate research synthesis, outlines, drafts, content refreshes, metadata suggestions, and gap analysis. They can help a lean team turn reporting findings into an editorial backlog more quickly. Used carefully, they support faster iteration on AI-ready websites and content.
They are not measurement systems. A drafted page is not proof that the brand appears in Google AI search, earns citations, improves ranking, or influences a pipeline outcome. Performance evidence must come from observed search experiences, Search Console, web analytics, CRM data, and documented source review.
The strongest workflow is sequential. First, identify high-value buyer questions and visibility gaps. Second, use content tools to help develop a fact-checked asset that answers the question with original expertise, clear sourcing, and useful structure. Third, validate technical accessibility and monitor subsequent AI-search observations, organic performance, and conversions.
Originality remains central because answer systems need credible material to reuse or recommend. Teams can strengthen their production standards by examining what original content needs before AI search systems can reuse or recommend it. The reporting model then verifies whether the work produced new evidence of discoverability rather than merely more published output.
Run a concise monthly leadership readout
Leadership does not need a spreadsheet of every tracked prompt. It needs a consistent narrative that makes uncertainty visible, identifies material movement, and assigns decisions. Limit the readout to a small number of question clusters tied to revenue priorities, then retain the detailed evidence for the search and content teams.
Use this checklist each month:
- Confirm coverage: Review whether tracked buyer questions still represent the product categories, objections, and markets that matter this quarter. Add emerging questions, but preserve a stable core set for trend comparison.
- Report the combined scorecard: Show AI answer appearance, citation rate, organic clicks, impressions, ranking distribution, and conversions by priority cluster. Flag meaningful changes and state the observation window.
- Inspect the evidence: Review representative answers, cited pages, competitor mentions, and source types behind every major change. Do not escalate a percentage change that cannot be explained with underlying observations.
- Separate facts from hypotheses: State what was observed, what may explain it, and what the team will test next. This prevents correlation from being reported as causation.
- Assign accountable actions: Name an owner, deadline, expected evidence, and success measure for each priority action. Revisit completed actions in the next readout.
How should teams handle attribution?
Treat AI-search visibility as a contributing discovery signal, not a deterministic attribution channel. A buyer may encounter an AI answer, return later through brand search, click a comparison article, and convert after several other interactions. Use assisted-conversion analysis, annotated reporting periods, and qualitative sales or customer-research feedback to build a more complete picture.
How should teams handle volatility?
Volatility is part of the environment, not necessarily a sign of reporting failure. Maintain a stable prompt panel, document locations and observation dates, compare multiple observations where feasible, and annotate major product or site changes. Report ranges and directional movement when the evidence warrants it instead of implying precision that the underlying systems cannot support.
What are the limitations of this model?
No dashboard can observe every personalized answer or fully reconstruct every buyer journey. Visibility observations are samples, citations can change, and conventional rank metrics are also aggregations rather than direct records of individual experience. The limitation is precisely why the model combines evidence types: no single metric should carry the entire strategic conclusion.
Build one view, then act on it
A useful Google AI search reporting model does not ask leaders to choose between AI visibility and traditional SEO. It connects the buyer questions where brands are discovered, the citations and trust signals that support those answers, and the organic traffic and conversion measures that show business response.
Configure a shared view in Seerly that connects tracked buyer questions, citation evidence, visibility observations, and your existing SEO performance review. With a common evidence base, marketing, content, and SEO teams can make clearer decisions about what to improve next - and explain those decisions without false certainty.