How to reconcile AI visibility, organic traffic and SEO data before a quarterly review
Organic growth reporting tools are changing what marketing teams need to report. A quarterly SEO review can no longer rely only on rankings, impressions, organic sessions and conversions when prospective buyers increasingly encounter brands through AI-generated answers and AI-led search layouts.
The challenge is not simply finding more metrics. It is deciding which evidence answers a leadership question, aligning the dates and conditions behind that evidence, and being candid about what the data can - and cannot - prove. This guide explains how to build a credible view of AI search visibility alongside established SEO performance, without turning a quarterly review into a collection of disconnected screenshots.
Start with the decision, not the dashboard
A useful leadership report begins with the decision it should make easier. That decision determines which measures deserve attention and prevents teams from treating every AI-search output as a business KPI. If the purpose is unclear, a dashboard can create false precision: a rise in answer mentions may look encouraging, while the actual question is whether brand perception, qualified demand or discoverability has improved.
Separate reporting decisions into four categories before selecting metrics:
| Leadership decision | Core question | Useful evidence |
|---|---|---|
| Awareness | Are more relevant audiences encountering the brand? | Answer presence, branded search demand, impressions, reach |
| Discoverability | Can people find the brand during category research? | Prompt coverage, rankings, cited sources, non-branded organic visibility |
| Demand | Is discoverability contributing to valuable site activity? | Organic sessions, engaged visits, leads, assisted conversions |
| Reputation | Is the brand represented accurately and credibly? | Answer accuracy, sentiment context, citation quality, brand claims |
These categories overlap, but they are not interchangeable. A brand might be widely mentioned in AI-generated answers while being inaccurately described. It might earn strong organic traffic from informational pages but have weak representation in high-intent category comparisons. Conversely, a decrease in rankings may not immediately reduce leads if demand is concentrated on a small group of high-converting pages.
Start each quarterly review with a sentence such as: “We need to decide whether to invest in improving category-level AI discoverability, protect reputation accuracy, or prioritise landing pages that convert existing search demand.” Every chart, table and annotation should then support that decision. This approach is especially valuable for agencies: it turns reporting from a retrospective performance display into a shared basis for prioritisation.
Define the AI-discovery measures
AI visibility is evidence that a brand, product, page or source appears within defined AI-search scenarios. It is not a universal measure of demand, traffic or revenue. The most reliable reporting treats it as a set of observed conditions, gathered through a stable prompt set and recorded with source-level detail.
A practical metric glossary
Answer presence measures whether the brand is named or substantively included in an AI-generated answer for a tracked prompt. It can be expressed as a percentage: brand present in 24 of 40 observed prompts equals 60% answer presence. This is useful for benchmarking discoverability, but it does not distinguish a favourable recommendation from a passing mention.
Cited-source appearance measures whether a brand-owned page or domain is cited, linked or otherwise surfaced as a source in the result. This is stronger evidence than brand mention alone because it shows the experience connected a user to the brand’s published material. Still, citation behaviour differs by platform and result format, so teams should record the platform, result type and source capture method rather than treating all citations as identical.
Prompt coverage is the share of a defined, relevant prompt set where the brand appears, is cited or is accurately described. The denominator is critical. Tracking ten prompts one month and 25 the next can create an apparent movement that is purely methodological, not a change in visibility.
Competitor comparison places the brand’s answer presence or cited-source appearance beside a consistent peer set. It helps a team understand relative visibility in a category, but it should not become a simplistic share-of-market claim. Competitors may target different audiences, geographies, price points and query types.
Answer accuracy assesses whether material statements about the brand are correct, current and appropriately qualified. This is a reputation measure, not merely a visibility measure. It matters because factual reliability remains a recognised challenge in language-model evaluation; OpenAI introduced its SimpleQA benchmark to measure factuality in short-form answers, illustrating why an unverified AI response should never be accepted as proof.
Worked example: representation versus recommendation
Consider a B2B software company that tracks 30 decision-stage prompts such as “best workflow software for regulated teams” and “workflow platforms with audit trails.” During the quarter, it appears in 18 answers, its domain is cited in nine, and reviewers judge 15 of the 18 mentions accurate. The team’s report should state three separate findings: 60% answer presence, 30% source appearance and 83% accuracy among observed mentions.
That is more useful than saying “AI visibility was 60%.” The first figure suggests representation; the second indicates that owned content was selected as a source; and the third exposes a reputational issue that may need correction. A competitor could appear in fewer answers but be cited more often, indicating a different content and authority opportunity.
Treat these observations as sampled evidence. AI systems may vary results over time and across settings, and evaluation research has emphasised the need for standardised, scenario-based testing rather than broad claims from isolated outputs; Stanford’s Holistic Evaluation of Language Models framework is a useful reminder that model behaviour needs defined conditions.
Connect AI-search evidence to established search performance
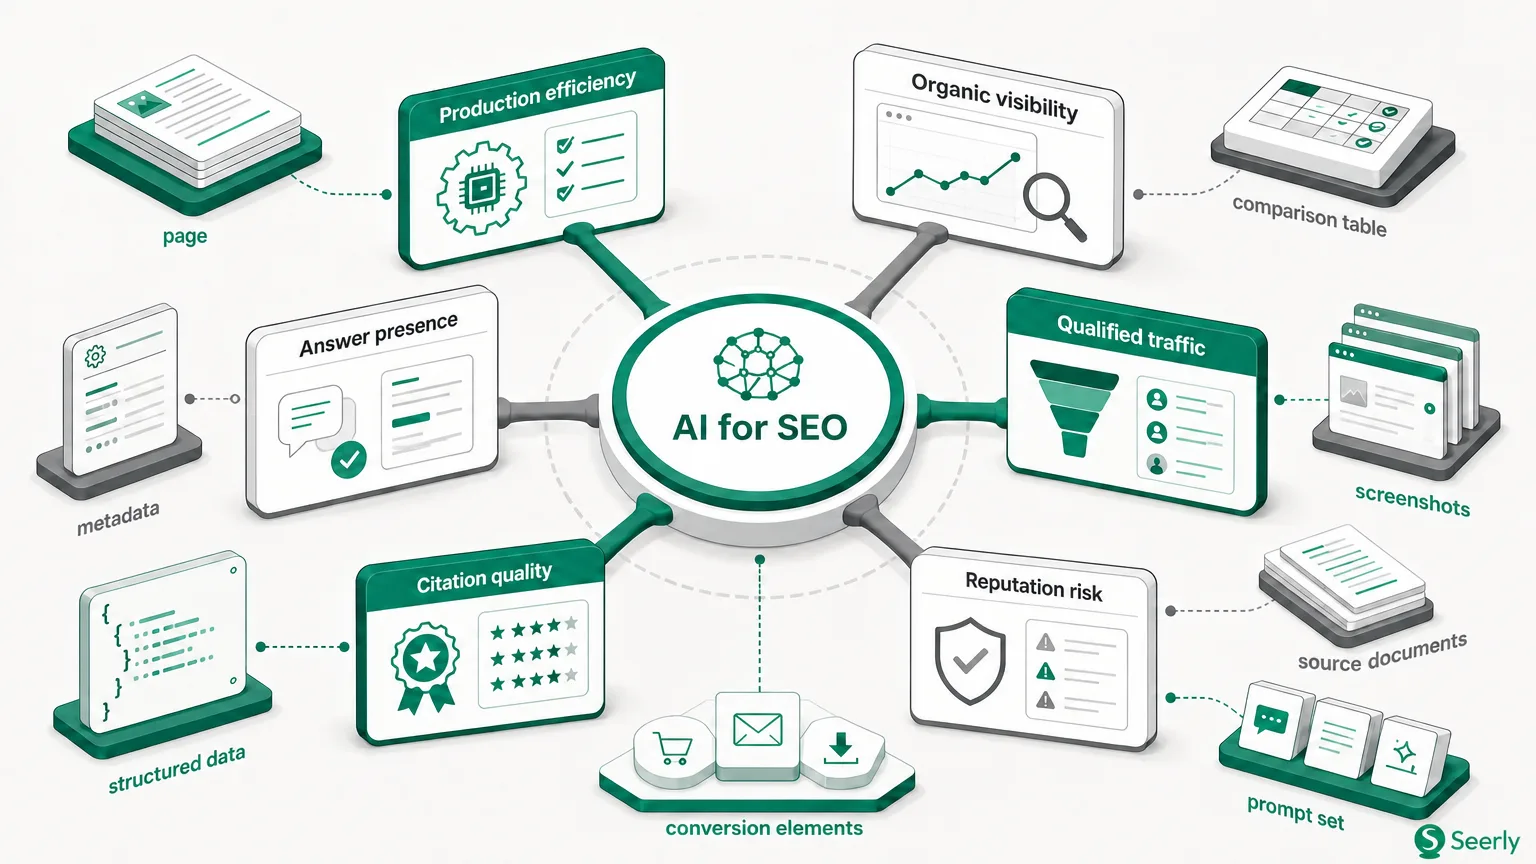
AI-search evidence belongs in the same leadership view as organic performance, but it should not be blended into a single score. Each measure describes a different stage of the customer journey and a different observation method.
| Metric pair | View together? | Keep separate? | Reason |
|---|---|---|---|
| Prompt coverage and non-branded rankings | Yes | Yes | Both indicate category discoverability, but one observes AI answers and the other search-result positions. |
| Cited-source appearance and landing-page organic sessions | Yes | Yes | A cited page may gain visibility, but analytics does not normally prove the AI citation caused the sessions. |
| Answer accuracy and conversion rate | For context | Yes | Inaccurate representation can create risk, but conversion data alone cannot quantify that effect. |
| Competitor AI visibility and organic share of voice | Yes | Yes | Comparative direction is useful, while methodologies and query sets remain distinct. |
| Organic conversions and revenue | Yes | No | These can remain directly connected when tracking and attribution definitions are consistent. |
Correlation is a starting point for investigation, not proof of causation. For example, a quarter may show increased answer presence, increased organic clicks and a higher conversion rate. That pattern can justify a hypothesis: perhaps stronger, more specific content improved both source eligibility and search performance. It does not establish that an AI-generated answer sent the traffic or created the conversion.
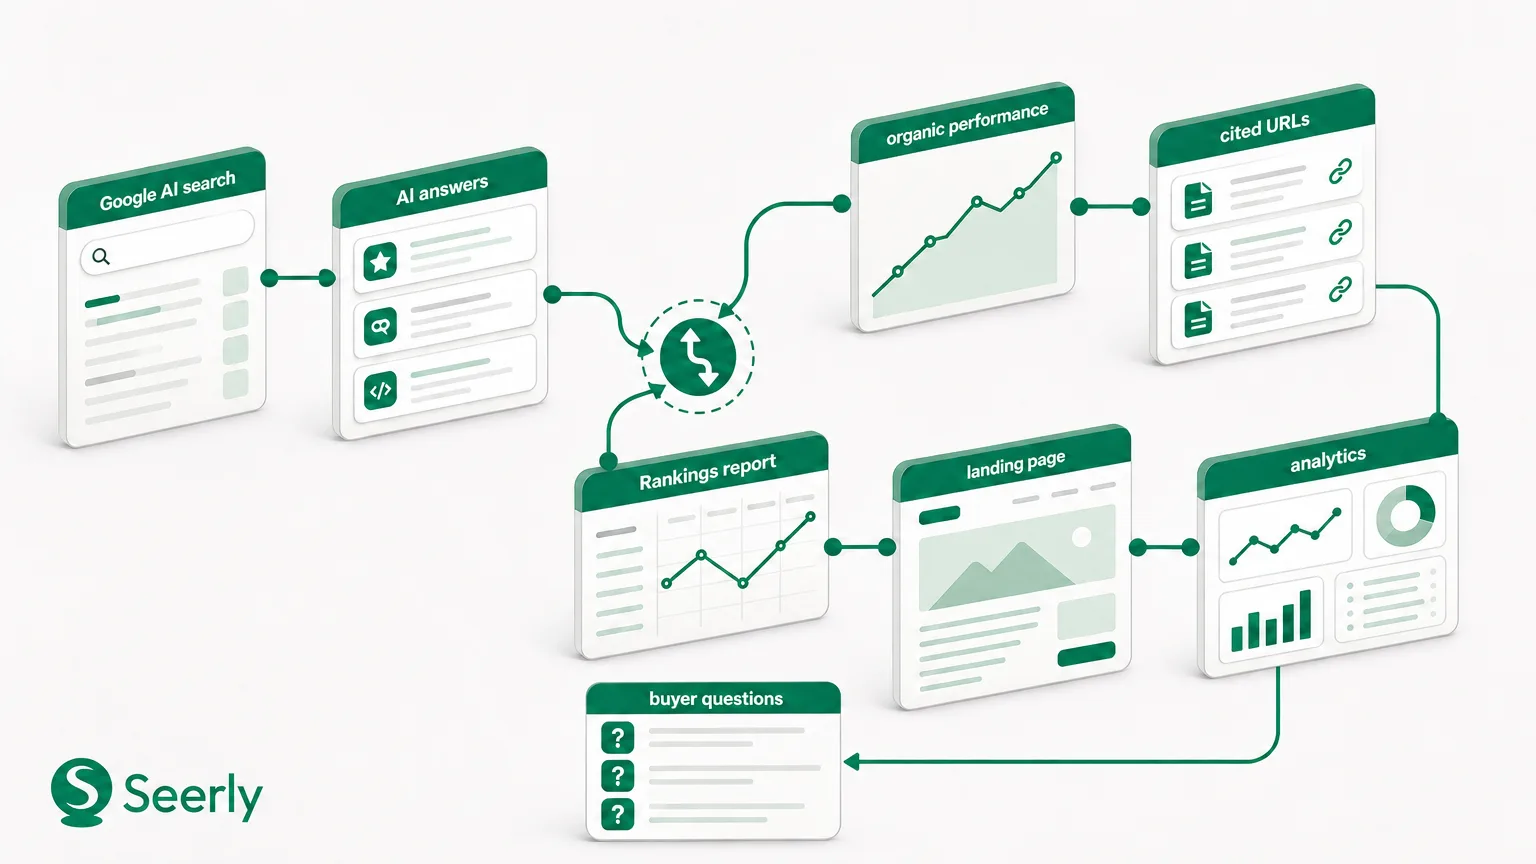
Use a shared reporting window wherever possible. If traffic data covers April through June, run AI visibility observations on dates within that same period, document the exact collection dates and retain the prompt definitions. Then compare movements at the page or topic level. Broad sitewide totals often hide the relationship leaders actually need to evaluate.
A credible model also distinguishes observed metrics from inferred outcomes. “Our product appeared in 10 more tracked answers” is an observation. “This caused 10% more pipeline” is an inference that requires a defensible attribution method, not a screenshot. This discipline matters as organisations expand AI use: Stanford’s AI Index reported that 78% of organisations said they used AI in 2024, increasing the need for reporting standards that remain meaningful as adoption grows.
Account for Google’s AI-led search experience
Google’s AI-led result experiences can change the path between a query and a landing page. A searcher may encounter an AI-generated summary, a set of cited sources, traditional organic listings, paid placements, videos, local results or a mixture of these elements. That means rank position alone may no longer describe the full page environment.
Record result layouts before interpreting performance
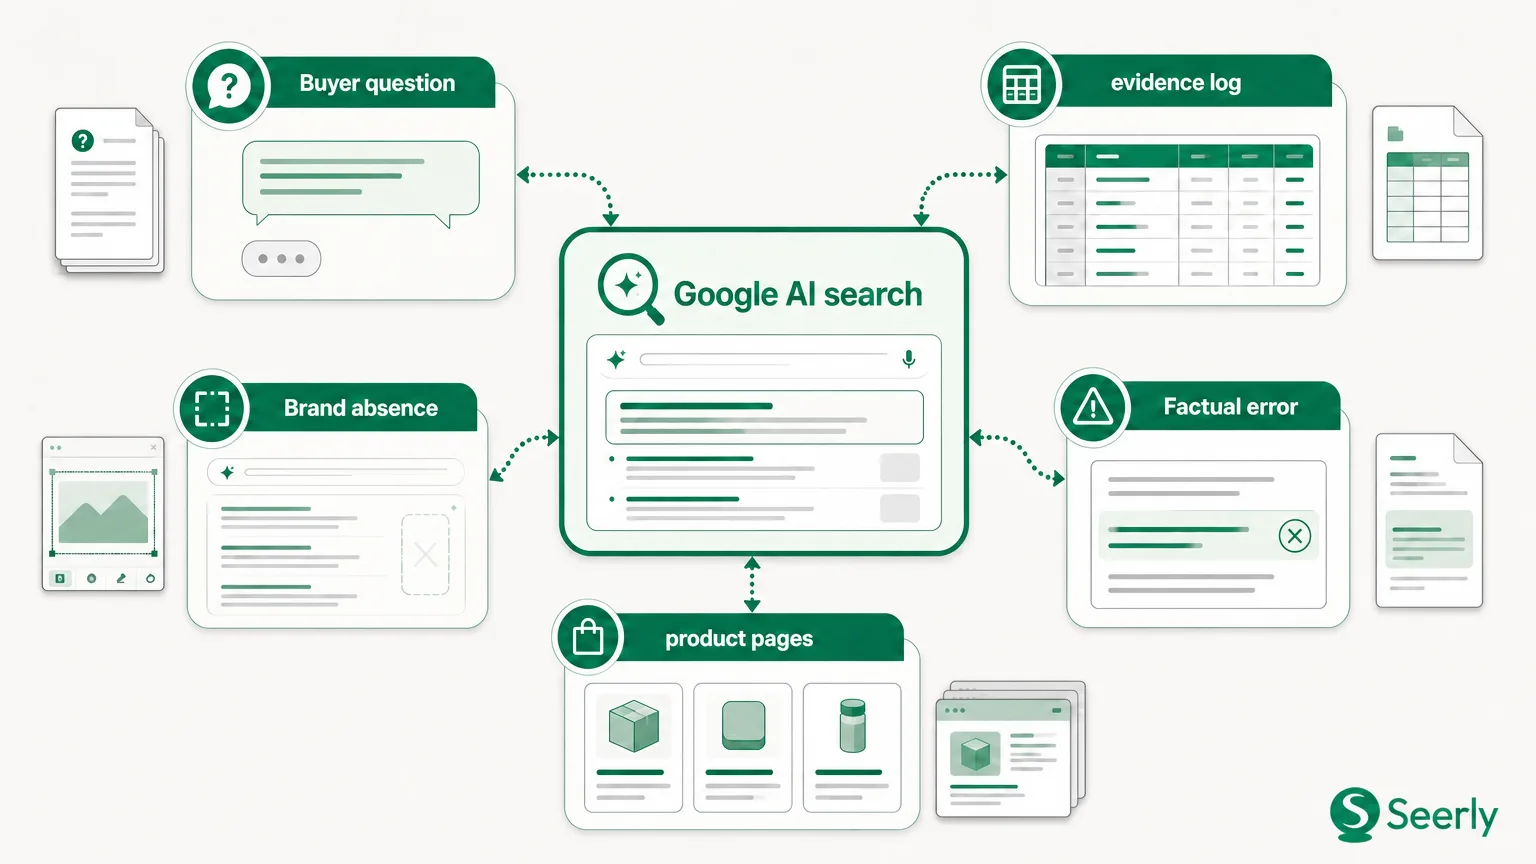
For priority queries, capture the observed layout on the same date as prompt testing. Record whether an AI-generated element appeared, which sources were visible, where the brand or page appeared, the country and device context, and whether the query was branded, informational or decision-stage. A simple annotation - “AI-led summary observed; competitor cited; our guide ranked below the fold” - adds necessary context to a traffic chart.
Next, map visible sources to relevant landing pages. If a brand’s technical guide is repeatedly surfaced while a product page earns the organic clicks, those are different roles in the journey. The guide may establish trust and eligibility for AI discovery; the product page may capture the demand that arrives through conventional search behaviour. Reporting should preserve that distinction.
Finally, measure landing-page performance using familiar analytics definitions: sessions, engaged sessions, key events, leads and conversion rate. Note major changes to titles, internal links, content, tracking, releases and campaigns. Do not state that a Google AI result directly reduced or increased traffic unless a platform provides attributable referral evidence and the analysis supports that conclusion.
Select organic growth reporting tools by evidence requirements
The best organic growth reporting tools for quarterly reporting are not necessarily those with the largest number of dashboards. They are the tools that let a team reconstruct how a reported number was produced. If a stakeholder asks why visibility changed, the team should be able to show the prompt, date, platform, response, cited sources and classification rules.
Use this evaluation checklist before placing a tool’s data in a leadership report:
-
Source capture: Can the tool preserve the observed answer, cited sources and result context rather than just reporting a score?
-
Date stamps: Does every observation show when it was collected, including relevant locale, device or platform conditions?
-
Prompt definitions: Can the team save the exact prompt wording, intent category, audience and inclusion criteria?
-
Exportability: Can evidence and underlying rows be exported for review, agency handover and audit?
-
Competitor context: Can the same prompt set be measured for a stable, documented peer group?
-
Traffic integrations: Can AI-discovery evidence sit beside analytics and search-performance data without merging unlike metrics?
-
Repeatable conditions: Can tests be rerun with consistent settings and an exception log when those settings change?
Evidence quality should influence confidence language in the report. A manually captured one-off answer can identify an issue worth investigating, but it is weak trend evidence. A repeated, date-stamped observation across a fixed prompt set is stronger. Teams looking to improve source eligibility can pair reporting with a review of what makes content more likely to earn citations in AI answers, while retaining the distinction between citation visibility and traffic attribution.
Build a reporting cadence that survives scrutiny
A quarterly review is only as credible as the routine that produced it. Set the process before the reporting period begins, not when an executive asks why a number changed.
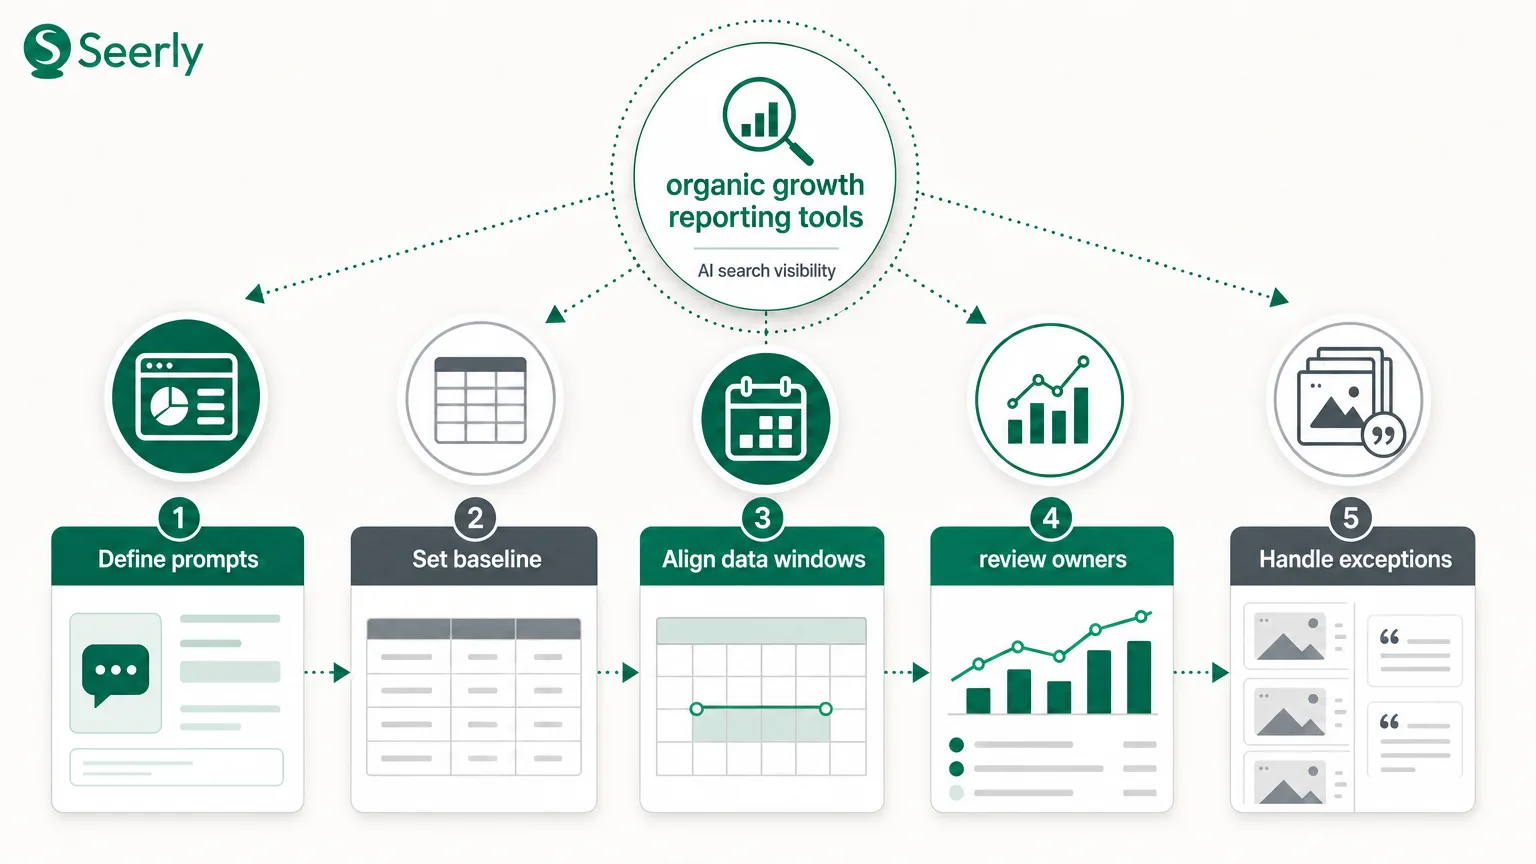
1. Establish a governed prompt set
Create a prompt inventory organised by funnel stage, product area, geography and decision type. Include category discovery, comparisons, use cases, implementation questions and reputation-sensitive prompts. Assign every prompt an owner and a rationale, then freeze the core set for the quarter; additions should be marked as additions rather than quietly changing the denominator.
2. Set the baseline and collection schedule
Capture a baseline at the start of the quarter and retest at a planned cadence, such as monthly or fortnightly for high-priority prompts. Use the same platforms, locales and evaluation rules whenever possible. If a platform changes its interface or a prompt becomes irrelevant, record the exception and explain whether historical comparison remains valid.
3. Align data windows and annotate changes
Choose a shared date range for organic traffic, Search Console-style performance data, conversions and AI observations. Maintain an annotation log for content releases, site migrations, technical incidents, tracking changes, PR activity and major campaigns. Annotations do not prove causality, but they stop teams from interpreting every movement as an AI-search effect.
4. Assign review owners and thresholds
SEO should validate query and landing-page context; content or product marketing should review answer accuracy; analytics should validate traffic and conversion definitions; and a senior owner should approve leadership conclusions. Set thresholds in advance - for example, investigate any accuracy issue on a high-intent prompt, or any prompt-coverage decline that persists across two scheduled observations.
5. Handle exceptions openly
Do not overwrite inconvenient results. If an answer cannot be captured, a platform response is unavailable, or a prompt behaves inconsistently, flag it as incomplete evidence. This is more credible than forcing a total. For teams managing several contributors, a documented manual workflow for resolving disagreements between AI SEO tools can prevent untested tool outputs from becoming client or board-level claims.
Present a worked leadership summary
An executive summary should state what changed, the evidence available, confidence in the interpretation and the next action. It should be readable in a minute while allowing the underlying evidence to be reviewed.
Observation: Brand answer presence for 40 decision-stage prompts increased from 45% to 58% during the quarter. Cited-source appearance increased from 20% to 28%.
SEO context: Non-branded organic sessions to the associated topic cluster were broadly flat, while organic conversions from two product landing pages increased 12%.
Evidence and confidence: Prompt wording, platforms and competitor set were unchanged; observations were collected on the planned schedule. Result-layout captures show that AI-led elements appeared on 14 of the 40 tracked search scenarios. Confidence is moderate: the visibility movement is repeatable, but available analytics does not attribute the landing-page conversion increase to AI-generated answers.
Next action: Review the 17 prompts where competitors were cited and the brand was absent. Update the three supporting guides with clearer evidence, expert attribution and product-fit details, then remeasure next quarter.
This format avoids two common mistakes: declaring victory from visibility alone and dismissing visibility because it does not have a direct conversion attribution line. It gives leaders a decision: fund the identified content and technical improvements, or maintain the current approach until a further measurement cycle confirms the pattern.
Resolve common reporting mistakes
What makes inconsistent prompts unreliable?
Changing wording, audience, location or intent changes the scenario being tested. A prompt asking for “best enterprise analytics tools” is not equivalent to one asking for “low-cost analytics tools for a small team,” even if both sit in the same category. Keep a stable core set, document new prompts separately and avoid comparing totals with different denominators.
Why are mixed date ranges a problem?
A 90-day traffic trend cannot be fairly compared with a single AI answer captured on the final day of the quarter. AI observations should be scheduled within the same reporting window and labelled with their collection dates. When timing differs, present it as context rather than a direct period-over-period comparison.
Are screenshots enough to support a leadership claim?
No. Screenshots are useful supporting evidence, but they need the prompt, capture date, platform, locale and classification rule behind them. Without that context, they are difficult to reproduce and easy to overinterpret. Preserve exports or logs so reviewers can trace the reported outcome back to the underlying observation.
Why are vanity totals risky?
A large “visibility score” can conceal whether the brand was accurate, whether owned pages were cited, or whether the prompts mattered to buyers. Break totals into answer presence, source appearance, accuracy and priority prompt groups. This makes the report more actionable and prevents a high-volume low-intent prompt set from outweighing the topics that influence real decisions.
Can AI visibility be converted directly into ROI?
Not responsibly without a validated attribution design. It is reasonable to report an observed increase in representation, investigate associated changes in demand or landing-page behaviour, and prioritise work based on business relevance. It is not reasonable to assign revenue to AI answers simply because visibility and conversions moved in the same direction.
Build a leadership view that can be verified
The goal is not to force AI visibility into traditional SEO metrics or to replace established performance reporting. It is to give leadership a clearer picture of discoverability, demand and reputation using measures that retain their meaning. A defined metric model, aligned dates, repeatable prompt conditions and traceable evidence make that possible.
To establish those definitions in Seerly, use Monitoring > Visibility to review representation, Monitoring > Prompts > Manage to govern your prompt set, Foundations > Analytics > Traffic Analysis to examine landing-page behaviour, and Foundations > Analytics > Search Performance to place visibility evidence beside search KPIs. Start by documenting one decision-stage topic cluster, then build a repeatable AI-search reporting workflow with Seerly before the next quarterly review.