AI visibility is a range, not a single score
A brand can appear in one AI-generated answer on Monday and be absent from a near-identical answer on Tuesday. That does not necessarily mean the brand gained or lost visibility. It may reflect ordinary variation in the model’s response, the sources it selected, the wording of the query, or changes in the search experience itself.
That is why AI search visibility measurement needs more than a screenshot of one favourable answer. Marketing leaders, SEO managers, and agencies need a documented sample: a defined set of buyer questions, repeated observations, consistent scoring, and an uncertainty rule agreed before results are reported. The aim is not to force a single number onto a variable system. It is to determine whether a change is large and persistent enough to guide a real decision.
This matters because generative search can affect discovery before a user visits a website. For example, Pew Research Center found that users clicked traditional search-result links less often when an AI summary appeared. Brands therefore need to understand not only traffic, but also whether they are accurately represented, recommended, and cited during AI-assisted research.
Why one AI answer creates false confidence
Imagine a B2B software company monitoring the buyer question, “What are the best platforms for managing distributed product teams?” On the first observation, the answer recommends the company by name, describes its collaboration feature accurately, and links to an industry publication that mentions it. The team records a win.
Two days later, with the same question in the same AI search environment, the response recommends three competitors instead. The company is not mentioned, even though the answer covers the same product category and buyer need. Neither observation, by itself, proves a durable visibility shift.
AI-generated answers are assembled dynamically. The model may place different weight on available sources, interpret a broad prompt differently, vary how many options it includes, or change the response structure from one run to the next. Research on variation across AI-search outputs, queries, and time reinforces the practical lesson for generative engine optimisation: one-off observations are not a reliable basis for judging performance.
A single answer can still be useful as an audit clue. It may reveal an inaccurate description, a missing source, or a competitor repeatedly framed as the category leader. But it is not adequate evidence for reporting that “visibility increased” or “we disappeared from AI search.” Those statements require a repeatable observation process that separates normal answer volatility from a sustained change.
Build a defensible prompt sample
A defensible sample starts with commercial relevance, not an oversized list of generic keywords. The questions should represent the ways priority audiences discover, compare, validate, and shortlist your offer. If the sample consists only of branded questions or terms your team already ranks for, it will overstate visibility and miss the discovery journeys where AI answers can shape preference.
Select questions by buyer stage and business priority
Build a prompt inventory across four dimensions: buyer stage, product area, market, and intent. This ensures the measurement set reflects meaningful brand discovery rather than whichever questions happen to produce favourable results.
| Dimension | What to include | Example question type |
|---|---|---|
| Buyer stage | Problem discovery, solution research, comparison, validation | “How can a retailer improve product-data governance?” |
| Product area | Strategic products, services, use cases, and differentiators | “What tools support multichannel product information management?” |
| Market | Priority countries, industries, company sizes, and languages | “Best compliance software for UK financial services firms” |
| Intent | Informational, comparative, transactional, and reputational | “Is [category] software suitable for enterprise teams?” |
Start with 30 to 50 high-priority questions for a focused programme. That is usually enough to cover key buyer journeys while remaining manageable for weekly review. Larger brands, agencies, and multinational teams may need separate samples by market or product line, but each segment should still be analysed independently rather than blended into a score that conceals important differences.
Write each question exactly as it will be tested. Record the target audience, market, language, buyer stage, product area, expected intent, and the business owner who can interpret the answer. Avoid adjusting wording after an unfavourable result unless the question itself is being formally revised; otherwise, the measurement set will drift and the trend line will lose meaning.
Set a repeatable observation schedule
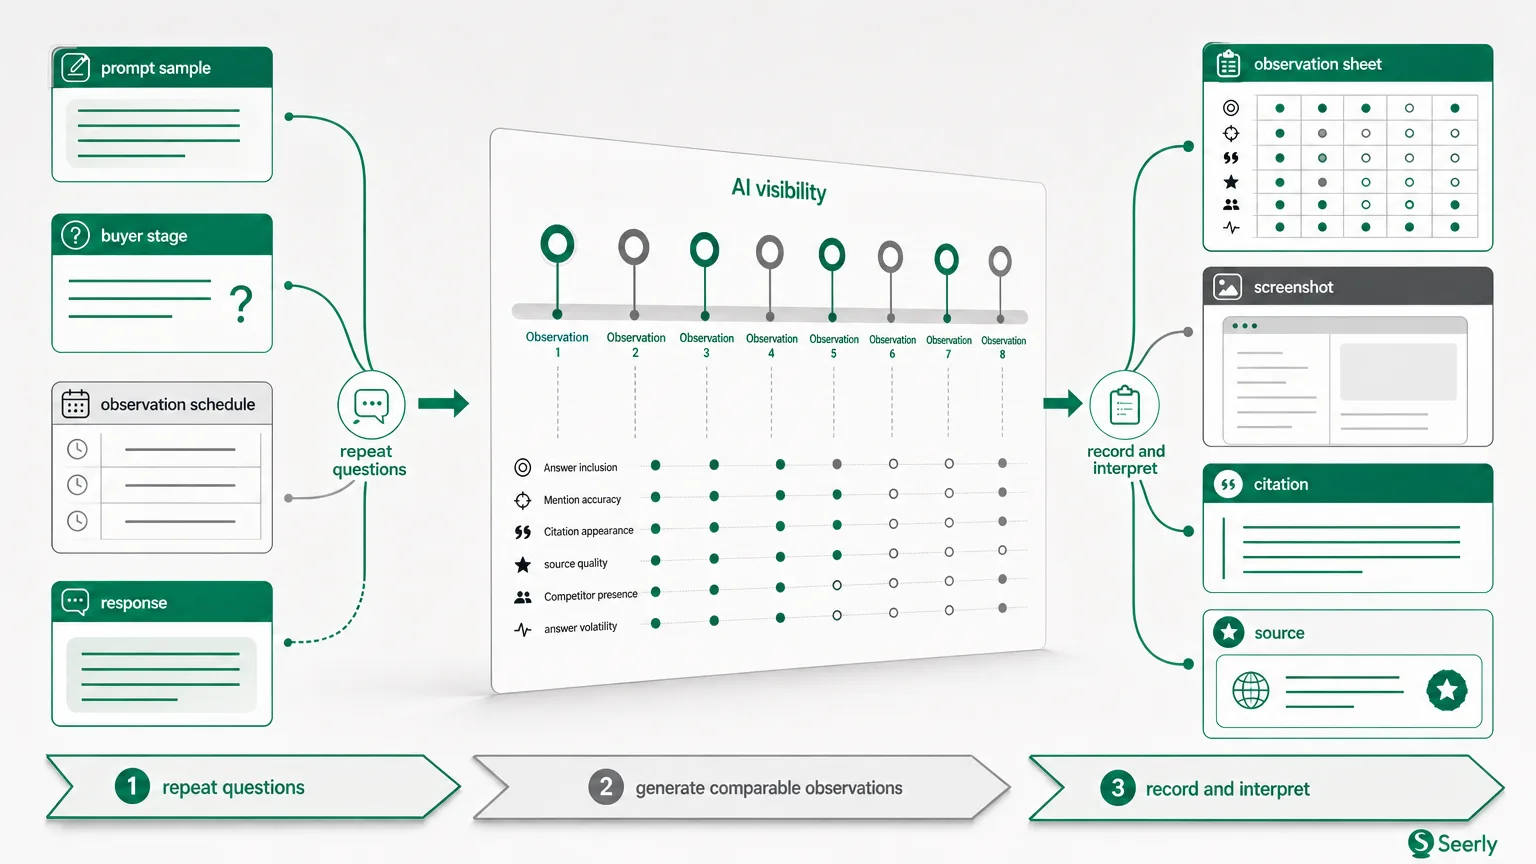
For a practical baseline, run each priority question five times in a defined environment during each measurement period. A 40-question sample observed five times produces 200 answer observations per period. That is not a universal statistical standard, but it is materially stronger than treating one response per question as a representative outcome.
Use the same AI product or search surface, geography, language, account state where relevant, device setting, and query wording for every cycle. Document the date and time, because an answer generated in one market or at one time may not be comparable to another. If an AI product changes its interface, source display, or response mode, log that as a methodology change rather than silently comparing incompatible results.
Weekly collection works well for active monitoring, while monthly reporting is usually more useful for leadership. The first four weeks should be treated as a baseline-building period, not as a verdict on performance. This approach fits with broader AI search optimisation tracking practices: the value comes from comparable observations over time, not a single point-in-time check.
Record the signals that matter
A name mention alone is a weak measure. A brand can be included but described incorrectly, mentioned only as an inferior alternative, or omitted from the sources users are shown. Each observation should capture the quality and context of presence as well as whether the brand appeared.
Use a consistent observation sheet with the following fields:
- Answer inclusion: Was the brand named, recommended, listed as an option, or only mentioned in passing? Record the answer position where ordering exists.
- Mention accuracy: Is the product category, feature set, market, and positioning factually correct? Note material inaccuracies separately from minor wording differences.
- Citation appearance: Did the answer display a source that links to the brand’s site, a third-party source that discusses the brand, or no visible source at all?
- Cited-source quality: Classify visible sources as first-party, independent editorial, analyst or expert, directory, community content, or low-confidence source. Quality is contextual: an official product page can support a feature claim, while an independent publication may carry more weight in a comparison.
- Competitor presence: Which competitors appear, how often, and in what role? Distinguish between a competitor merely named and one explicitly recommended.
- Answer volatility: Record meaningful changes in brands named, citations shown, factual framing, answer format, and recommendation strength across repeated runs.
This level of detail turns monitoring into a diagnostic system. If inclusion falls but third-party citations remain stable, the issue may be answer composition rather than a genuine loss of source visibility. If the brand remains present but inaccurate, the priority is representation and entity clarity rather than simply increasing mention frequency.
Keep evidence with each entry: a saved response, date stamp, environment details, and a short analyst note. Screenshots are useful for review, but structured fields make it possible to calculate trends. For teams investigating source authority, a separate review of backlinks that influence AI-search visibility can help distinguish broad link volume from the sources likely to shape category understanding.
Set an uncertainty threshold before reporting movement
No sample size removes AI-answer variability entirely. The goal is to define a rule that makes reporting disciplined: normal variation should be monitored, while changes that exceed the expected range and persist should be investigated.
Establish a baseline range
Calculate an inclusion rate for each measurement period:
Inclusion rate = observations that include the brand ÷ total valid observations
Suppose a 40-question set is run five times weekly, creating 200 valid observations. Across the first four weeks, the brand inclusion rate is 59%, 63%, 61%, and 64%. The baseline average is 61.75%, while the week-to-week spread is relatively narrow.
Rather than presenting 61.75% as a precise truth, report it as an observed baseline range. In this example, a sensible working range might be roughly 57% to 66%, depending on the team’s chosen tolerance and the observed variation. The exact rule matters less than setting it before a campaign, content release, or stakeholder review.
Use a material-change rule
A practical reporting rule for many teams is to flag a shift only when all three conditions apply:
- The inclusion rate changes by at least five percentage points from the baseline average.
- The change is greater than two times the baseline’s normal week-to-week variation.
- The change appears in two consecutive measurement periods, unless a major documented platform or brand event requires urgent review.
In the example above, a single weekly result of 56% should not automatically be framed as a visibility loss. It is close to the expected range and may be ordinary response variation. But results of 52% and then 51% would be materially below the baseline, exceed the five-point floor, and persist across two weeks. That is evidence worth investigating and reporting as a likely negative shift.
Apply the same logic to positive movement. A one-week jump from 62% to 70% is encouraging, but it is not proof that a content change caused a durable gain. If the next period remains elevated and other signals support the finding - such as stronger citation appearance or improved accuracy - the team can report a higher-confidence change.
This is a decision threshold, not a claim of laboratory-grade statistical certainty. AI-answer observations are not perfectly independent, and model updates can alter the environment. Be transparent about the sample, time window, tool settings, and rule used. That transparency makes visibility benchmarking more credible than an unexplained score.
Reconcile AI observations with search data
Prompt-sample monitoring answers a different question from conventional search reporting. It shows whether and how a brand appears in a controlled set of buyer questions. It cannot establish how many users saw those answers, how often an answer was triggered in the wider market, or whether visibility produced visits and revenue.
Google’s documentation explains that Search Console can measure content performance in generative AI features on Google Search and Discover. Its newer reporting capabilities can help teams analyse impressions, clicks, and performance patterns where generative experiences are included. Those metrics are essential, but they do not replace answer-level observation: Search Console does not tell a team whether a specific answer represented the brand accurately, omitted a key product, or elevated a named competitor.
Use the three data sets together:
| Data source | What it can establish | What it cannot establish alone |
|---|---|---|
| Repeated AI-answer observations | Brand inclusion, framing, citations, competitors, and volatility for priority questions | Total audience exposure, traffic, or conversion impact |
| Generative-search performance data | Impressions, clicks, and traffic patterns from eligible Google generative features | Exact answer wording or brand presence in every user session |
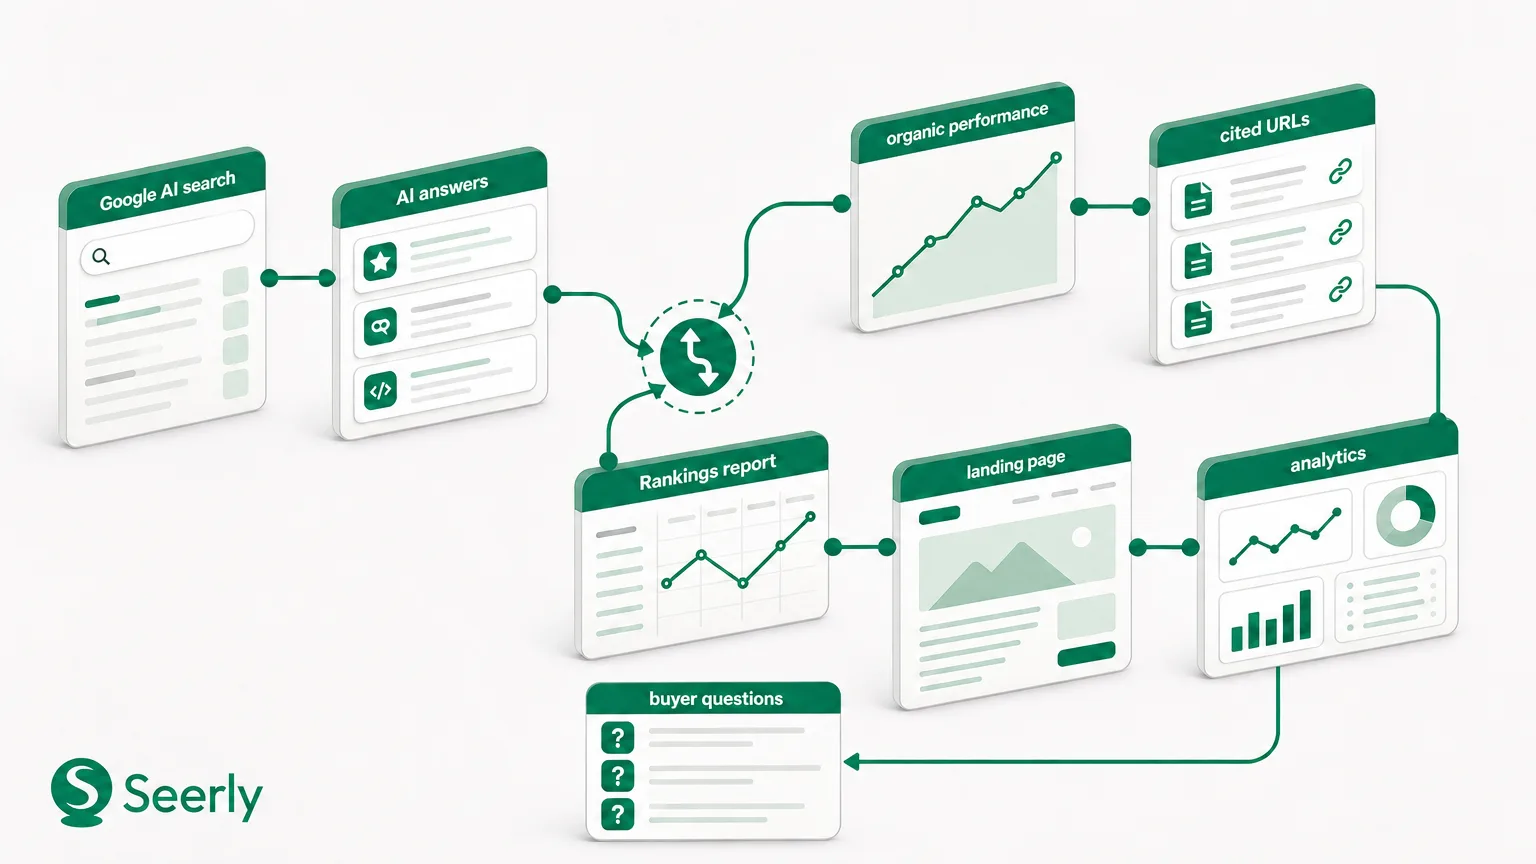
| Conventional organic search data | Rankings, clicks, landing-page performance, and demand trends | How AI systems summarise or recommend the brand |
When the signals disagree, do not average them into a vague conclusion. A brand may gain organic clicks while appearing less often in monitored AI answers, or gain AI citations while organic rankings remain flat. The right response is diagnosis: compare the affected query groups, cited pages, markets, and dates. Seerly’s guide to when AI visibility and organic search disagree provides a useful framework for treating these as related but distinct performance signals.
Create a weekly decision log
Measurement only becomes operational when someone owns the next action. A weekly decision log prevents teams from reacting to isolated screenshots or forgetting why a score changed. It also creates an audit trail when leadership asks whether a change was observed, confirmed, or acted on.
Use a shared log with the following fields:
| Field | What to document |
|---|---|
| Date and measurement period | Collection dates, markets, tools, and any environment changes |
| Signal detected | Inclusion, accuracy, citation, competitor, or volatility change |
| Evidence | Baseline, current result, sample size, saved examples, and affected questions |
| Confidence | Low, medium, or high, based on the pre-agreed uncertainty rule |
| Likely explanation | Content gap, source-quality issue, competitor activity, platform change, or unknown |
| Owner and action | Named owner, proposed action, and completion date |
| Retest date | The next period for confirming whether the change persists |
A material decline in accurate mentions may warrant a content audit, stronger product documentation, or a review of third-party sources that define the category. A decline in high-quality citations may point to an authority or distribution problem rather than a page-level SEO issue. A rise in competitor visibility may justify a comparison-content review, but only after checking whether the shift persists across the full sample.
The key is to match the action to the evidence. Do not refresh content because one answer omitted the brand, and do not dismiss a persistent change because conventional rankings stayed stable. The log should make clear what the team knows, what remains uncertain, and when it will test again.
Treat AI visibility as evidence, not an anecdote
AI search visibility measurement is most useful when it behaves like a disciplined monitoring programme. Define the questions that matter, observe them repeatedly, capture answer quality as well as inclusion, and set the uncertainty threshold before anyone sees the result. Then combine those findings with generative-search and organic-search performance data to understand both representation and business impact.
Create a priority-question baseline, establish a repeatable observation cadence, and use the resulting evidence to decide whether content, citation, or reputation action is warranted. Seerly helps teams monitor AI search visibility, benchmark competitor presence, and turn changing AI answers into decisions grounded in documented evidence.