The KPI map marketing teams need before adding AI visibility to performance reporting
Your organic report looks healthy: rankings are stable, clicks are steady, and conversions remain within expectations. Meanwhile, an AI answer recommends competitors for a buying question your team considers essential. Nothing in the existing dashboard necessarily reveals that gap.
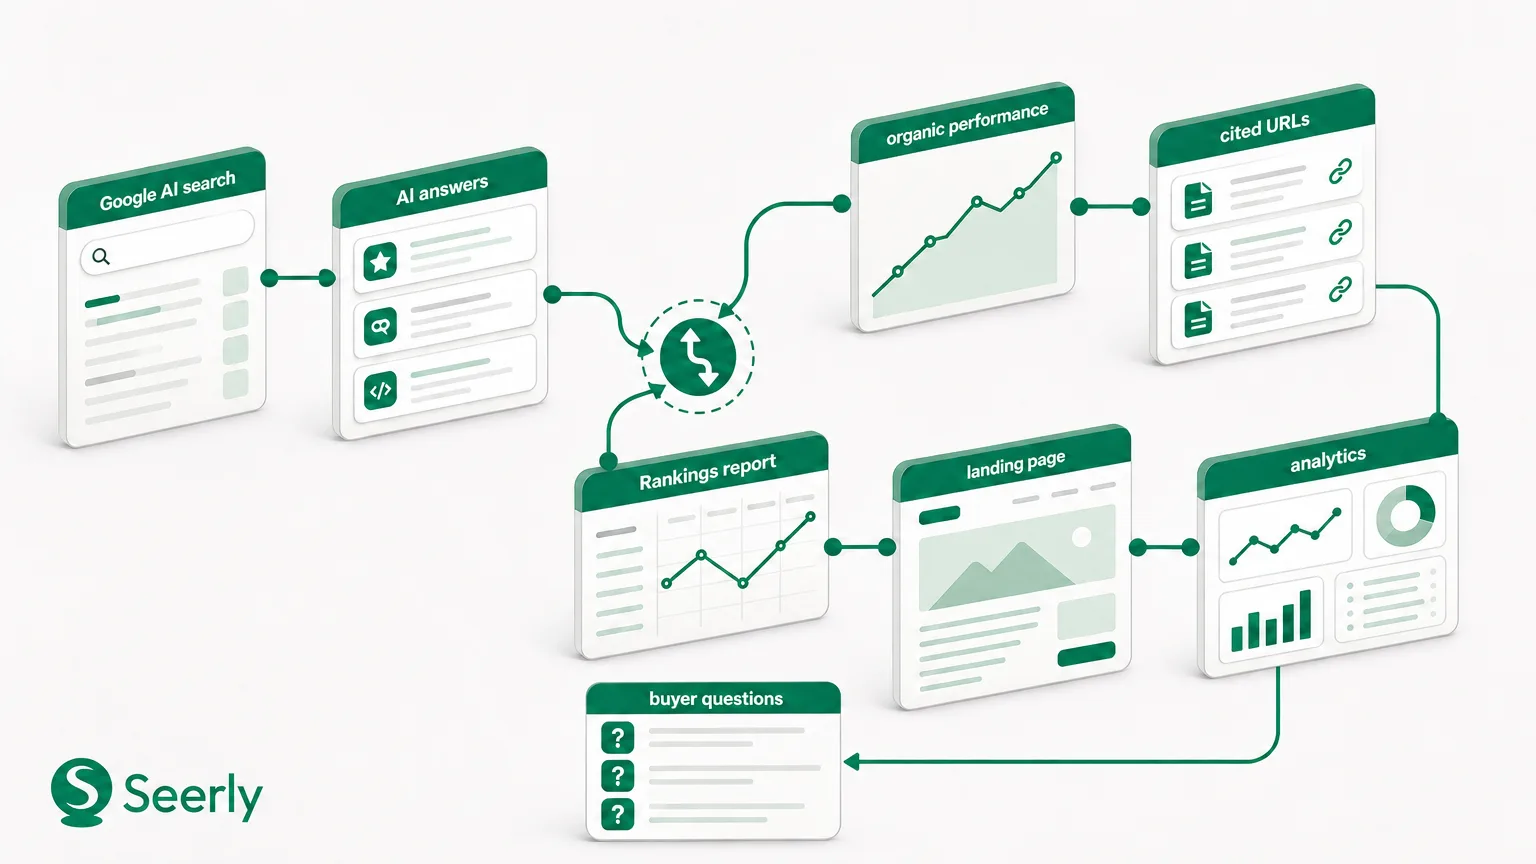
Where can teams track AI visibility alongside organic traffic and SEO KPIs? In a shared reporting layer that brings AI-answer evidence together with search and conversion data - without treating them as interchangeable measures. That might be a connected platform or an existing business-intelligence dashboard. The location matters less than the definitions underneath it.
Before evaluating AI content tools, establish one rule: every metric needs a definition, an owner, an evidence source, and a decision it informs. This KPI map makes AI visibility reportable without creating competing numbers or another dashboard leadership cannot interpret.
Why a healthy organic report can miss AI discovery changes
Consider a hypothetical software brand whose product pages retain their rankings. Its monthly organic clicks remain stable, but monitored AI answers stop recommending it for a priority use case. Existing traffic may reflect other topics, branded demand, or visitors who already know the company. Stable aggregate performance therefore does not establish stable AI discovery.
| Signal | What it measures | What it cannot establish alone |
|---|---|---|
| Keyword rankings | Search position for selected queries under tracked conditions | Whether AI answers mention or recommend the brand |
| Organic clicks | Recorded clicks from unpaid search results | Exposure that produces no visit |
| AI-answer presence | Brand appearances in sampled responses | Total audience reach or resulting revenue |
| Conversions | Defined actions recorded under an attribution model | Whether an unobserved AI interaction influenced the buyer |
These signals describe different stages of discovery and response. They can move independently without either dataset being wrong. The reporting task is to explain their relationship, not force them into a single performance score.
Define the minimum shared KPI set
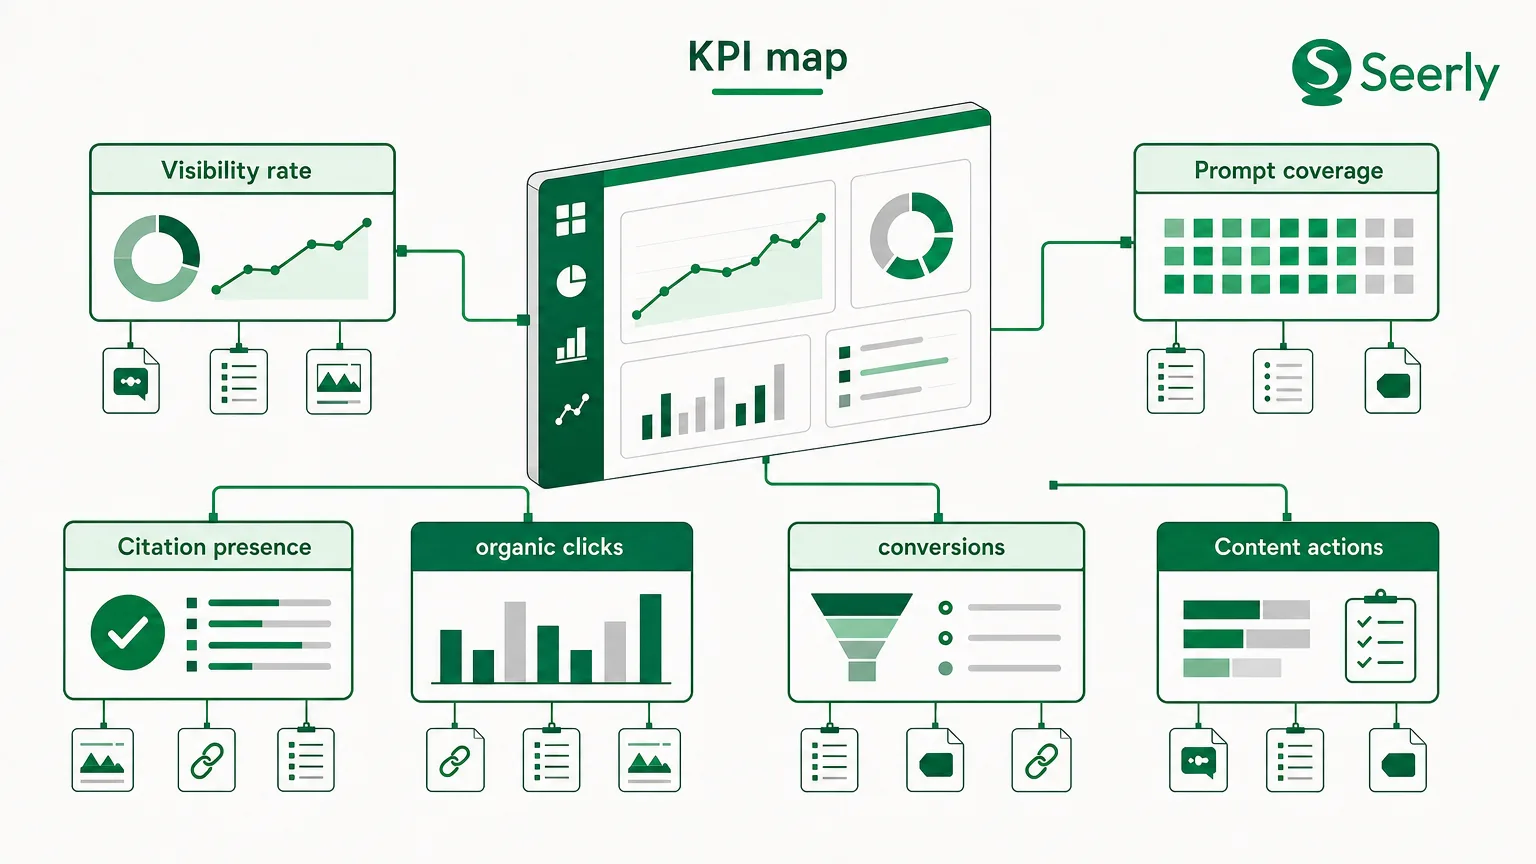
Use a small dictionary before configuring a dashboard. The definitions below are proposed reporting conventions, not universal industry standards. Adopt them consistently, document exceptions, and keep the denominator visible whenever reporting a percentage.
| KPI | Definition and boundary | Owner and evidence | Decision supported |
|---|---|---|---|
| Visibility rate | Valid sampled responses mentioning the brand ÷ all valid sampled responses. Count each response once; a mention is not necessarily a recommendation. | AI-search lead; saved responses and collection logs | Which topics need investigation? |
| Prompt coverage | Scheduled prompt-and-provider combinations with valid evidence ÷ all scheduled combinations. Measures collection completeness, not brand success. | Analytics operations; run logs | Is the sample sufficiently complete to report? |
| Citation presence | Valid responses containing at least one linked, brand-owned source ÷ all valid responses. Record third-party brand references separately. | SEO lead; answer snapshots and destination URLs | Which owned pages earn citations? |
| Representation signals | Human-reviewed labels for recommendation, neutrality, criticism, and factual accuracy. Keep accuracy separate from sentiment. | Brand lead; excerpts and review rubric | Does a claim require correction or escalation? |
| Organic clicks | Clicks recorded by the selected search-performance source, segmented by topic and landing page | SEO lead; search-performance export | Is search acquisition changing? |
| Conversions | Agreed business events attributed under a documented analytics model and window | Analytics lead; analytics or CRM records | Is observed acquisition producing business outcomes? |
| Content actions | Evidence-linked changes with a URL, owner, publication date, and review date | Content lead; change log | What should be published, corrected, or retested? |
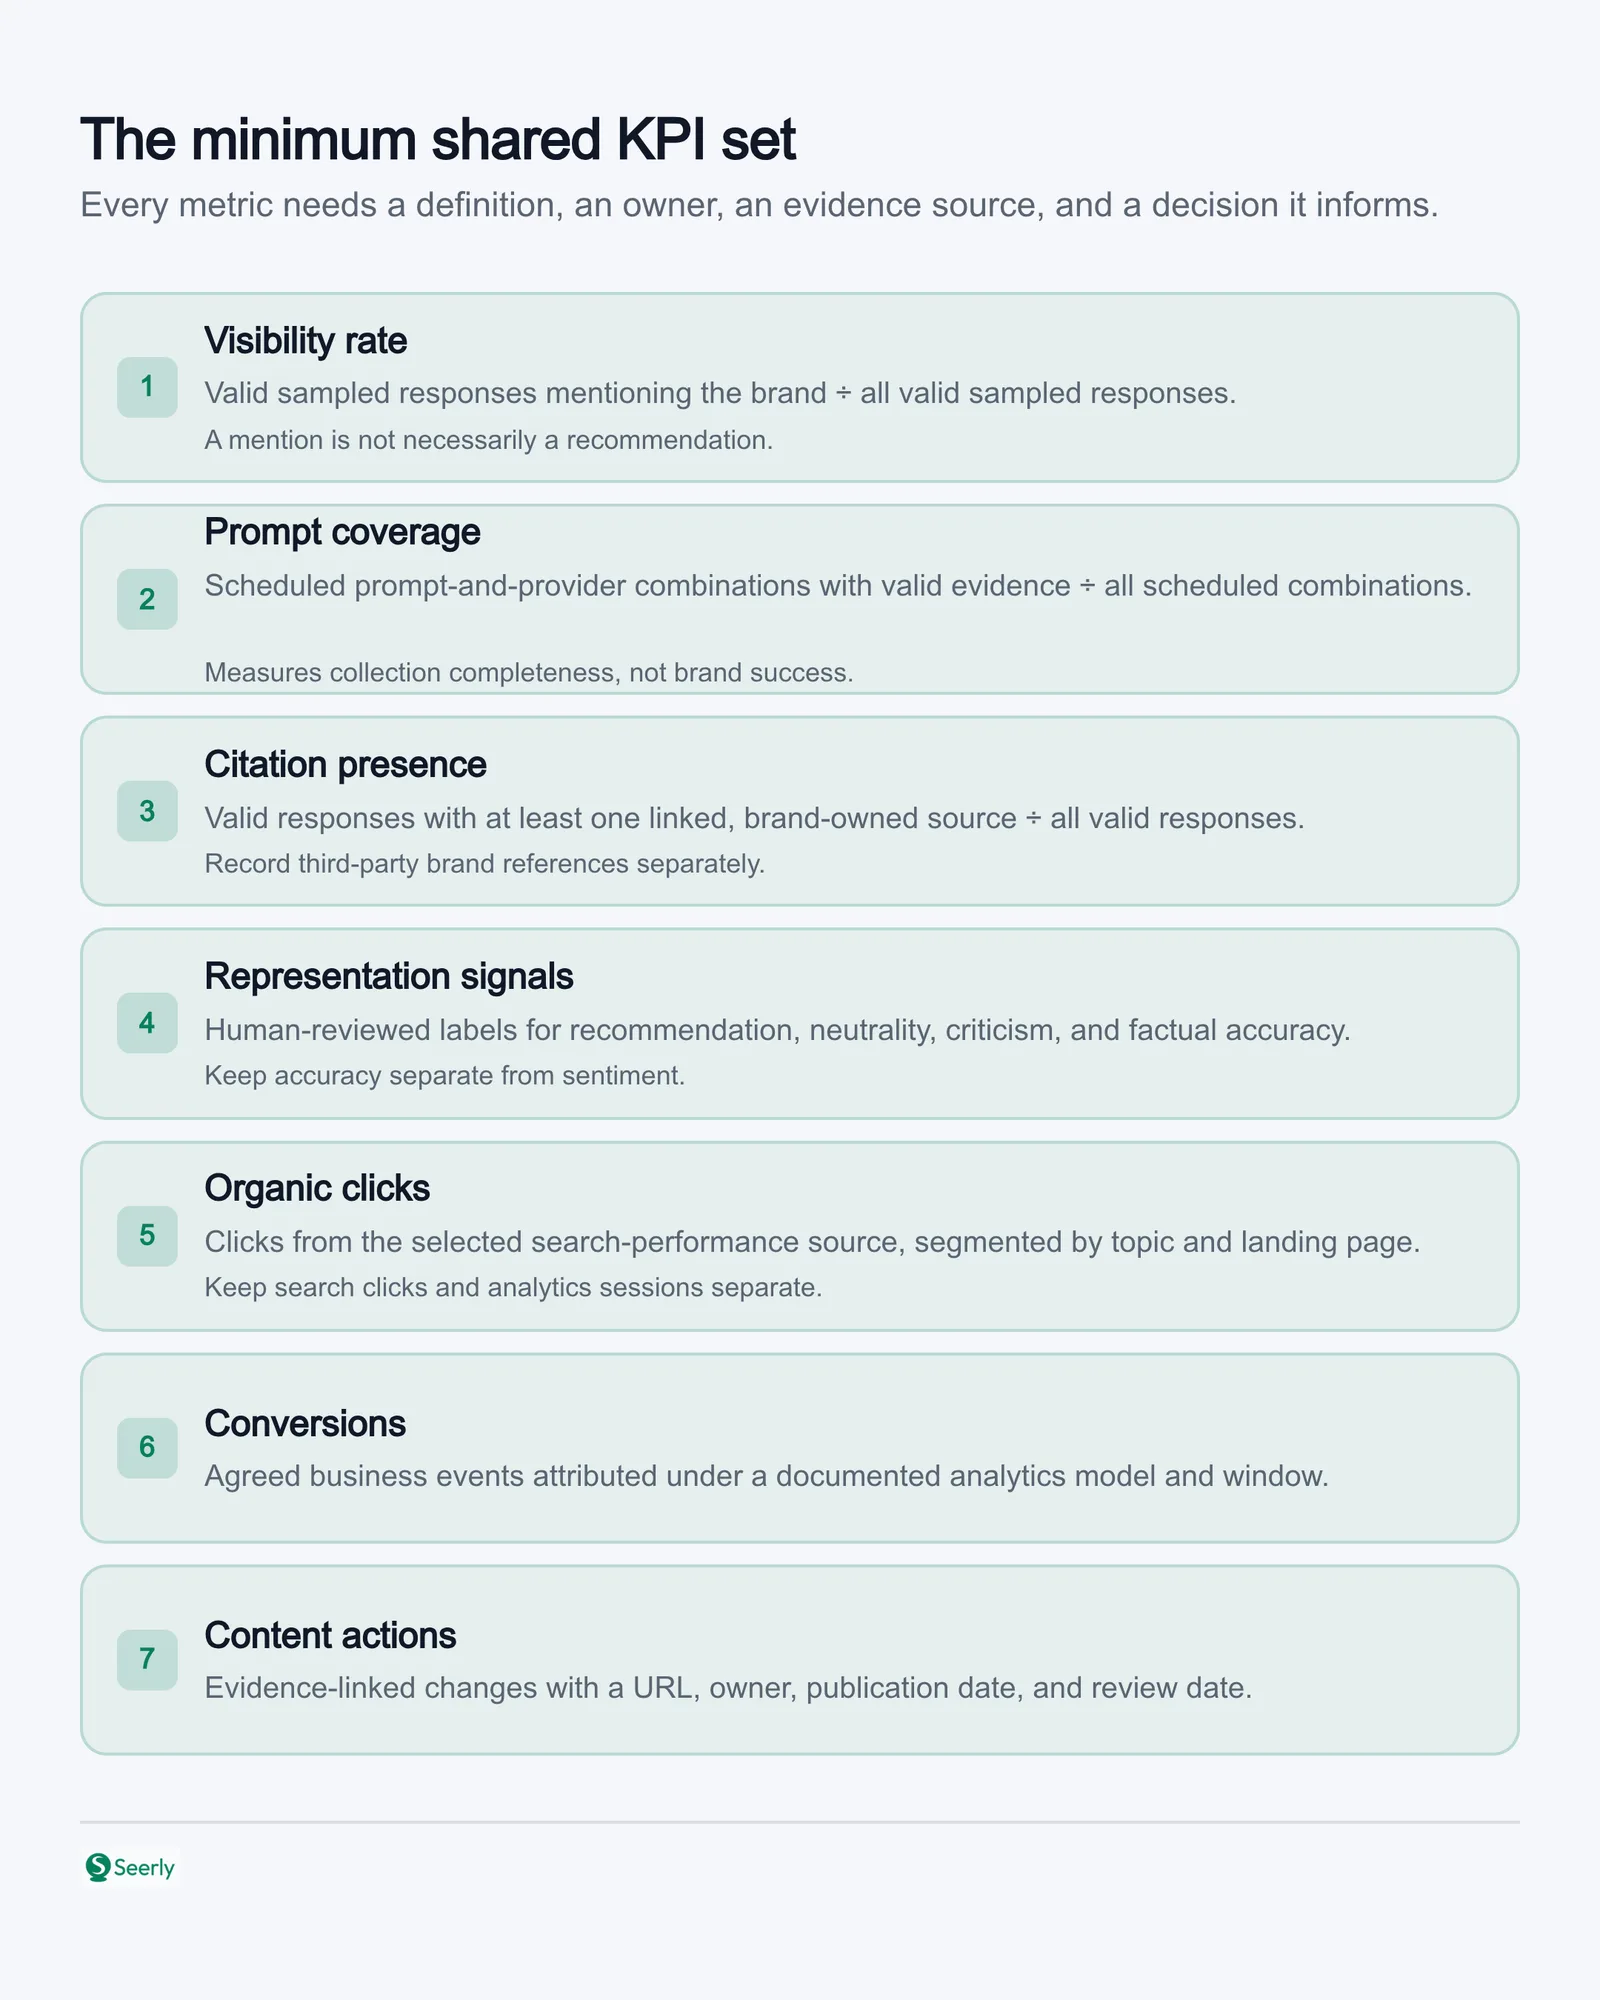
Use consistent definitions and keep the denominator visible whenever reporting a percentage.
Add a measurement period, market, language, and methodology version to every record. For visibility, retain numerators and denominators rather than exporting percentages alone. Track failed collections separately instead of counting them as brand absence.
Search clicks and analytics sessions should also remain separate. Choose a source of record for each metric, then reconcile discrepancies rather than silently replacing one with another. For agencies, apply the same dictionary across clients while keeping each client’s prompt sample and commercial priorities distinct.
Connect AI evidence to organic metrics without claiming causation
Use shared topics and landing pages to connect datasets. A sampled answer can identify a citation opportunity or a representation problem, while organic data shows what happened in a measured acquisition channel. Neither observation proves that one caused the other.
| AI-search observation | Organic comparison | Appropriate next question |
|---|---|---|
| Owned page gains citations | Page clicks and conversions | Is there any corresponding acquisition change? |
| Brand disappears from answers | Topic rankings, impressions, and clicks | Is this an AI-specific gap or a broader discovery issue? |
| Answer misstates a feature | Relevant product-page performance | Is the source content clear, current, and consistent? |
Example: citations appear while clicks remain flat
In this hypothetical example, saved answers begin citing a brand’s implementation guide, while clicks to that guide remain flat. The observation is increased citation presence within the monitored sample - not increased traffic. Review the excerpts to establish whether the guide supports an explanation, a recommendation, or merely a passing reference.
The report can record improved citation presence and unchanged acquisition as separate findings. It should not assign revenue to the citations or describe them as a failed traffic campaign. The next action might be to check factual accuracy and continue monitoring before changing the page.
Example: organic demand declines
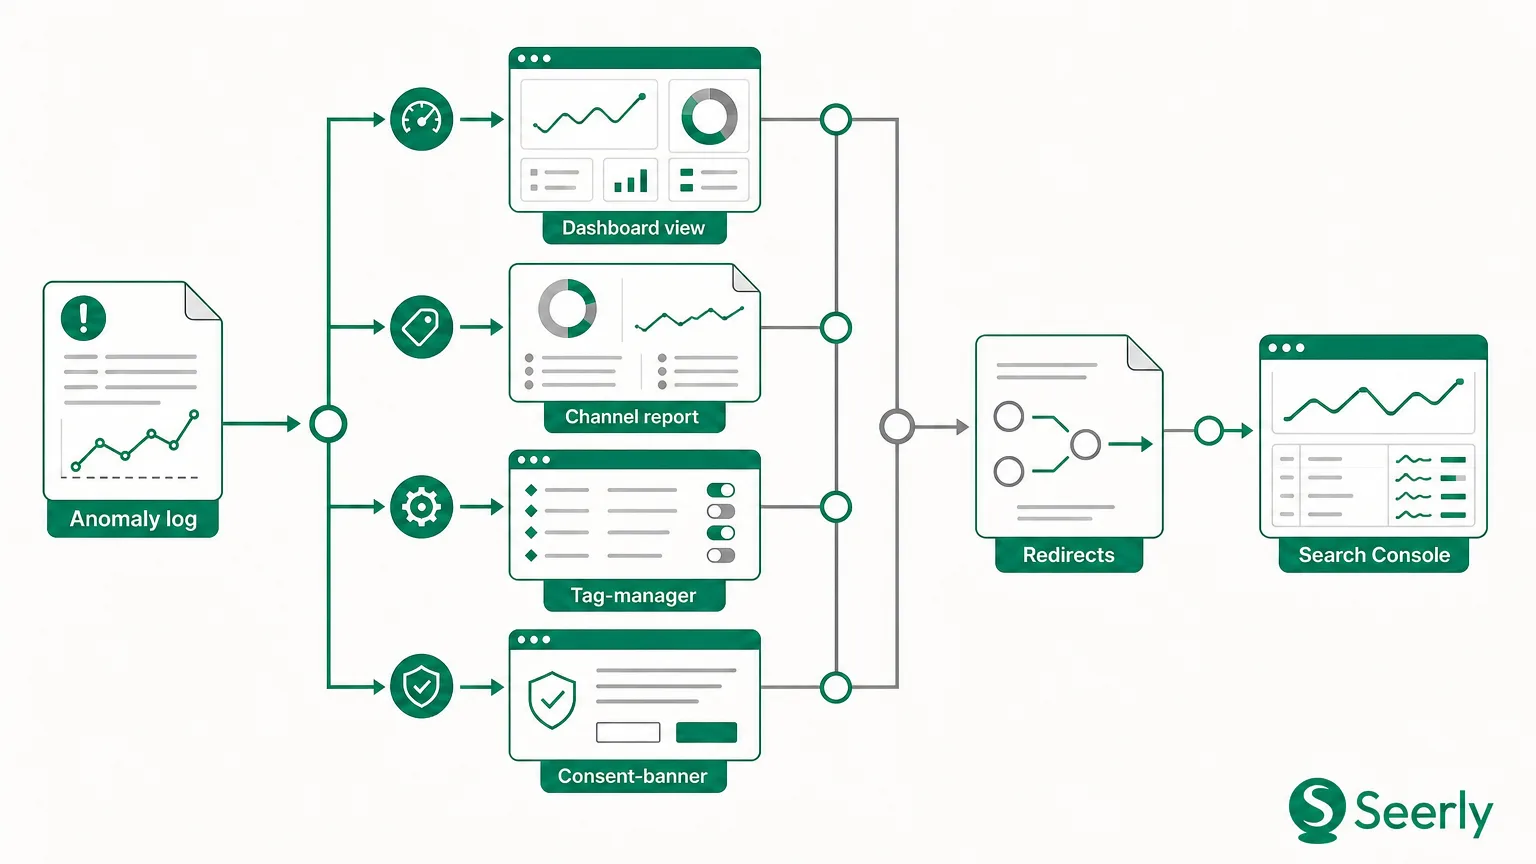
In a second hypothetical example, a topic loses impressions and clicks while monitored AI visibility remains stable. Stable visibility does not explain the traffic decline, and lower impressions do not independently prove lower market demand. Investigate ranking changes, indexing, seasonality, query mix, and tracking changes before settling on an explanation.
If broader demand evidence supports a decline, record that conclusion separately from AI visibility. Use comparable dates, markets, and topic groups wherever possible. When those conditions differ, mark the comparison as directional rather than like-for-like.
What AI content tools must provide before leadership reporting
Content-production capability is not measurement capability. A controlled writing experiment found that generative AI reduced completion time by 40% and increased assessed quality by 18%, but those findings do not establish better AI visibility or commercial performance. Evaluate AI content tools against the reporting decisions they must support, not output volume.
Use this buyer checklist during a trial:
-
Configurable prompts: Can you control wording, intent, market, language, and branded versus unbranded questions?
-
Saved evidence: Can reviewers inspect the answer, citations, timestamp, and original request?
-
Historical comparisons: Can you compare unchanged samples and identify methodology changes?
-
Transparent conditions: Are provider, interface, model where available, search settings, and collection failures recorded?
-
Checkable exports: Can exported rows reproduce reported counts and connect to existing analytics?
-
Action tracking: Can an observation connect to a content task, owner, publication date, and retest?
Ask a vendor to reconstruct one reported percentage from its underlying records. Then inspect an inaccurate or ambiguous answer, not just a successful example. The GPT-4 technical report acknowledges that the model can produce hallucinations and reasoning errors, reinforcing why generated interpretation should remain distinguishable from captured evidence.
For execution, connect measurement to content workflows with tracked actions. The useful unit is not simply “an article published,” but an evidence-linked change with a defined review date. Publication completes a task; it does not establish an outcome.
Monitor several AI-search environments through one process
Build one evidence structure with provider-specific fields, rather than separate reporting systems for every platform. Include relevant experiences such as ChatGPT search, Google AI Overviews or AI Mode, Perplexity, Microsoft Copilot, and Gemini where collection is feasible and permitted. Prioritize environments based on audience relevance and available evidence, not an obligation to monitor everything.
-
Create a controlled question set. Group prompts by customer need, buying stage, topic, and market. Separate branded questions from unbranded discovery questions, and version every change.
-
Define collection conditions. Record language, location where controllable, date, interface, and account state. Identify whether the evidence came from a consumer interface, API, or manual review; do not assume these are equivalent.
-
Capture provider-specific evidence. For Google experiences, retain the search query, whether an AI feature appeared, and its cited links. For conversational experiences, retain the prompt, answer, search or grounding state where visible, and linked sources. Save model or mode details when exposed; mark unavailable fields explicitly.
-
Normalize shared fields. Use consistent fields for brand mention, recommendation, owned-domain citation, cited URL, and representation flags. Preserve the original answer alongside the normalized record.
-
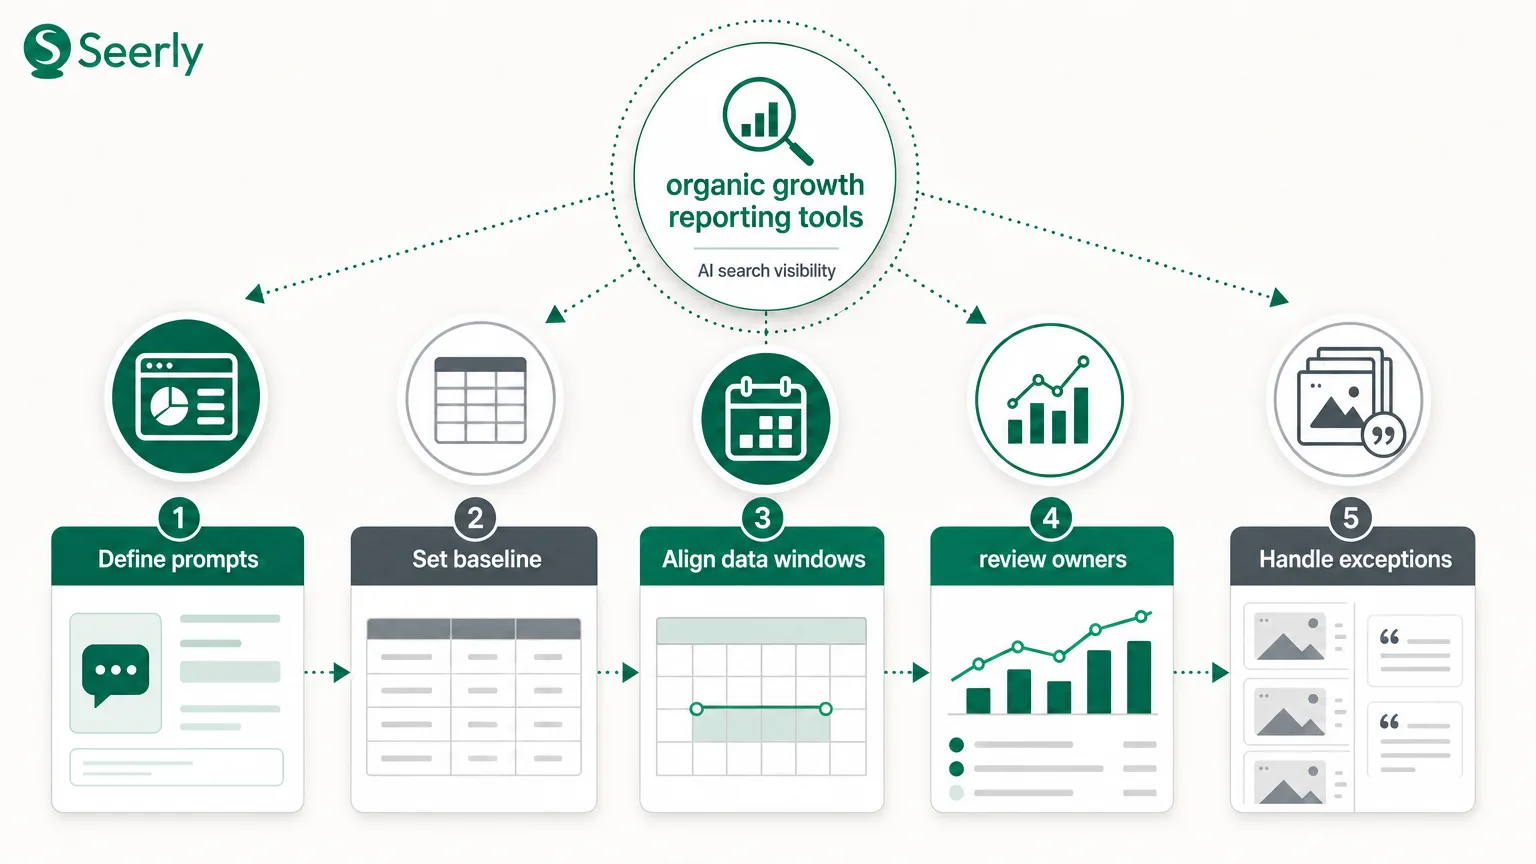
Review exceptions and compare matched periods. Separate collection failure from a successfully observed absence of an AI answer. Keep repeated-test frequency and aggregation rules stable, and label any sample change.
Keep provider results as drill-downs beneath shared KPIs. If leadership needs an aggregate, use documented, stable weights and disclose missing coverage; otherwise, changing the provider mix can change the headline without any underlying improvement. Teams can use a shared AI search visibility reporting workflow while preserving the distinctions needed for interpretation.
A one-page executive-report template
Leadership needs evidence, a defensible interpretation, and a decision. Keep detailed provider tables and answer snapshots in an appendix. Copy the following structure into the monthly report, retaining links to source records.
| Report field | What to include |
|---|---|
| Scope and confidence | Period, markets, prompt-set version, providers, coverage, and comparability limits |
| Observation | Visibility and citation counts, representation issues, organic clicks, and conversions versus a matched period |
| Interpretation | Most plausible explanation, alternative explanations, and unresolved questions |
| Action | Specific change, accountable owner, due date, and evidence supporting the priority |
| Outcome | Previously completed action, review window, observed result, and attribution limits |
| Decision required | Approval, resources, further investigation, or a documented choice to wait |
Distinguish an intended outcome from an observed one. “Improve accuracy” is an objective; a reviewed answer containing the corrected fact is evidence within that sample. A monthly narrative brand report should preserve those boundaries rather than turn every movement into a success claim.
FAQ
Can AI visibility and organic traffic share one dashboard?
Yes, provided their definitions and sources remain visible. Organize them around shared topics, markets, and reporting periods rather than combining unlike metrics. Keep evidence one click away from the headline.
Does citation presence measure AI-search market share?
No; it describes citation frequency within the defined sample. It does not reveal how often real users encounter those answers. Report sample composition and collection coverage alongside the rate.
How often should teams review results?
Set collection frequency around priority and operational capacity. Review collection quality during monitoring, then use matched reporting windows for leadership decisions. Investigate factual inaccuracies when discovered rather than waiting for the monthly report.
Start with the definitions, then configure the tools
AI visibility becomes reportable when every metric has a definition, owner, evidence source, and decision. Audit those four fields before adding another chart. Resolve gaps before interpreting movement.
Next, build a controlled prompt set in Monitoring > Prompts > Manage. Compare captured evidence in Monitoring > Visibility with organic performance in Foundations > Analytics > Search Performance. Keep observations, interpretations, actions, and outcomes separate so leadership can decide what to do next.