Measuring AI Overview traffic by query type, not headline click-through rate
An overall organic click-through-rate chart can show that something changed after AI Overviews began appearing. It cannot show what changed, where it happened, or whether the business impact is negative. A decline may be concentrated in high-volume informational queries that rarely convert, while product-comparison and branded queries continue to bring in qualified visitors.
That distinction matters because AI Overview traffic is not one uniform channel. Searchers use Google differently depending on whether they are learning, comparing options, navigating to a known brand, or preparing to act. To diagnose a traffic movement responsibly, marketing teams need to segment performance by query intent, AI-answer presence, citations, page type, and downstream outcomes - not rely on a headline CTR alone.
Why does one overall click-through-rate number hide the real impact?
A blended CTR combines queries with radically different search behaviour. An informational question such as “what is generative engine optimisation?” may be answerable within an AI Overview, reducing the immediate need for a click. A query such as “Seerly pricing” or “AI visibility platform for agencies,” however, may still require a user to visit a site to evaluate features, trust signals, and commercial fit.
That means a lower sitewide CTR does not automatically indicate lower demand for your brand or offering. It may reflect a changed mix of queries, an increase in AI-answer visibility for top-of-funnel questions, a shift in rankings, or a change in the number of impressions generated by each query group. Treating those movements as one number can obscure both the affected audience and the appropriate response.
Observed user behaviour supports the need for this query-level view. Pew Research Center found that users clicked a traditional search-result link on 8% of visits with an AI summary, compared with 15% of visits without one. That finding is important, but it should not be read as a universal forecast for every publisher, category, or query. It describes an aggregate behaviour pattern; your measurement should establish which parts of your own search portfolio resemble it.
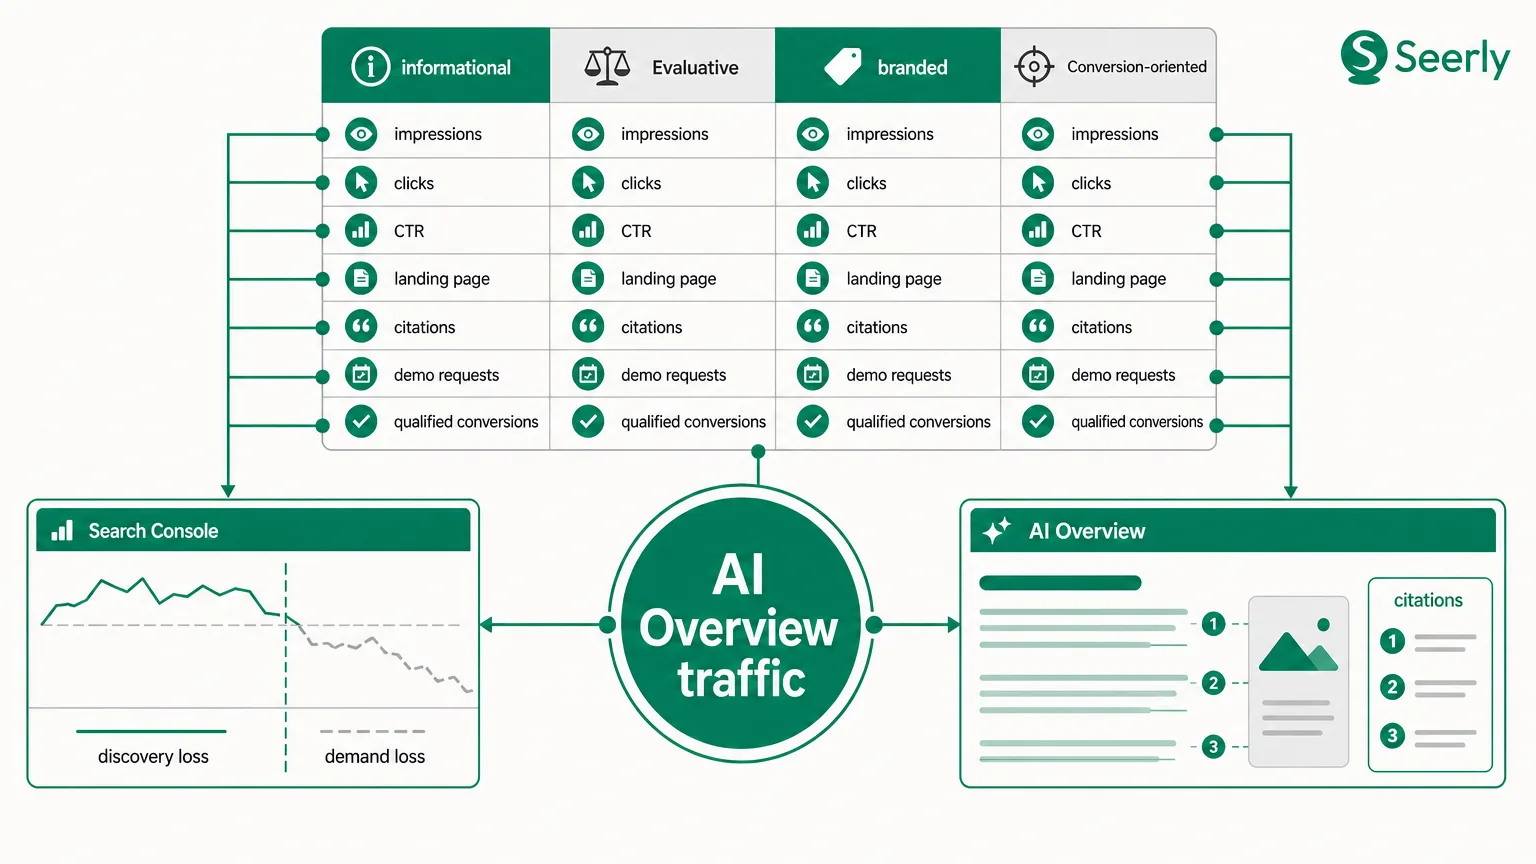
Start by creating a query-level dataset rather than analysing a single Search Console average. For each important query group, track impressions, clicks, CTR, average position, landing page, AI Overview presence, whether your site is cited, and the assisted or direct outcomes that follow. The resulting view makes it possible to separate a discoverability loss from a conversion opportunity loss.
Why can click volume and click quality point in different directions?
Two interpretations of AI-driven search change can both be true at once. On one hand, AI summaries may satisfy more basic informational needs inside the results page, leaving fewer clicks for publishers. On the other, users who do click after reviewing an AI-generated answer may arrive with stronger intent, more context, or a more specific evaluation need.
Google has argued that total organic click volume from Search to websites had remained relatively stable year over year while average click quality increased. This is a useful hypothesis to test, not a substitute for first-party reporting. “Quality” should be defined through measurable business outcomes: engaged sessions, documentation use, newsletter subscriptions, demo requests, qualified leads, pipeline creation, purchases, or retention actions relevant to your model.
Publisher evidence also warns against assuming all sites experience the same result. Chartbeat reported traffic pressure on news publishers associated with AI search features, while research into AI Overview behaviour has identified meaningful differences by user intent and result type. For example, AI Overview prevalence and citation patterns vary across query intents, which makes a generic “AI Overviews reduced our traffic” conclusion analytically weak.
The practical implication is simple: measure click volume and click quality separately. If clicks fall but lead quality, conversion rate, and pipeline contribution hold or improve, the problem is different from a broad decline in demand. Conversely, a stable click total can conceal risk if the traffic lost came from high-intent comparisons and the remaining visits are less likely to progress.
Which query segments should be separated before diagnosing a loss?
Build a monthly benchmark that places every priority query into one of four intent groups. The labels can be adapted to your category, but the measurement fields should remain consistent across teams and reporting periods.
| Query segment | Typical searcher need | AI-answer fields to record | Traffic fields to compare | Business outcome to review |
|---|---|---|---|---|
| Informational | Learn a concept or solve an early-stage problem | AI Overview present; your domain cited; citation position or prominence | Impressions, clicks, CTR, landing-page engagement | Email signup, return visit, content progression |
| Evaluative | Compare approaches, vendors, features, or alternatives | AI Overview present; cited competitors; accuracy of brand representation | Clicks to comparison, use-case, and product pages | Demo start, pricing-page progression, qualified lead rate |
| Branded | Find your company, product, reviews, or support resources | AI Overview presence; brand mention quality; source citations | Branded impressions, clicks, sitelink behaviour | Trial login, support completion, direct conversion |
| Conversion-oriented | Complete a commercial or high-intent action | AI Overview presence; cited transactional pages or marketplaces | Clicks, conversion rate, cost or value per visit | Purchase, booked meeting, submitted form, revenue |
This template also helps teams account for publisher category. A news publisher may place greater value on pageviews and subscription starts from topical discovery. A SaaS company may accept lower traffic from broad educational terms if evaluative and conversion-oriented paths remain healthy. An ecommerce brand may need to distinguish product-research queries from product-specific queries, because their AI-answer exposure and purchase potential are unlikely to match.
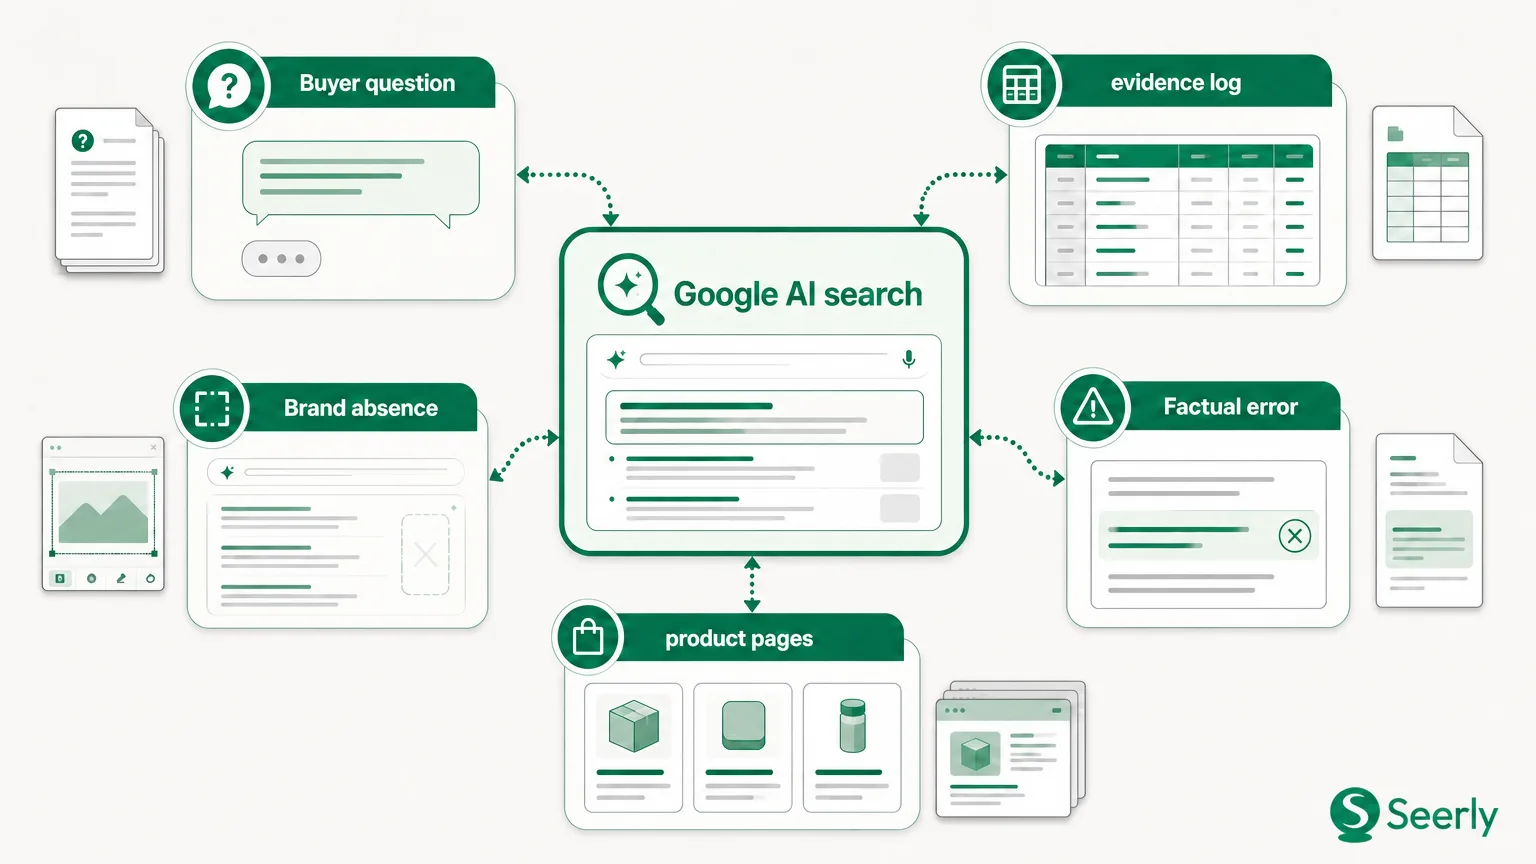
Citation tracking deserves its own field because visibility and traffic are not identical. A cited page may lose immediate clicks while gaining brand exposure, or it may be cited inaccurately alongside competitors. Teams should therefore monitor the frequency, context, and correctness of citations rather than count them as an automatic success metric. Seerly’s explanation of how AI systems decide which sources to cite provides useful context for treating citations as a discovery surface that requires validation.
How can a team compare discovery loss with demand loss?
Consider an illustrative monthly comparison for a B2B software company’s informational cluster. Search impressions remain stable at 100,000, clicks fall from 4,000 to 2,800, and observed AI Overview presence rises from 20% to 55% of sampled queries. At the same time, demo requests attributed to those landing pages hold steady because the visitors who still arrive are more likely to explore product content.
This pattern suggests a discovery-loss question, not necessarily a demand-loss conclusion. The team should investigate whether it is cited in AI answers, whether the cited explanation is accurate, and whether pages can better support users who need deeper guidance than the overview provides. The response may include strengthening original research, improving comparison content, and creating clearer paths from educational pages to relevant product evidence.
Now compare that with a second cluster: evaluative queries. Impressions fall 30%, clicks fall 35%, AI Overview presence is unchanged, and demo requests plus qualified conversions also decline. This is more consistent with weakening demand, ranking visibility, competitive displacement, or a market-level shift - not an AI Overview effect alone. The team should examine rankings, competitor citations, messaging, page relevance, and search demand before changing its content strategy.
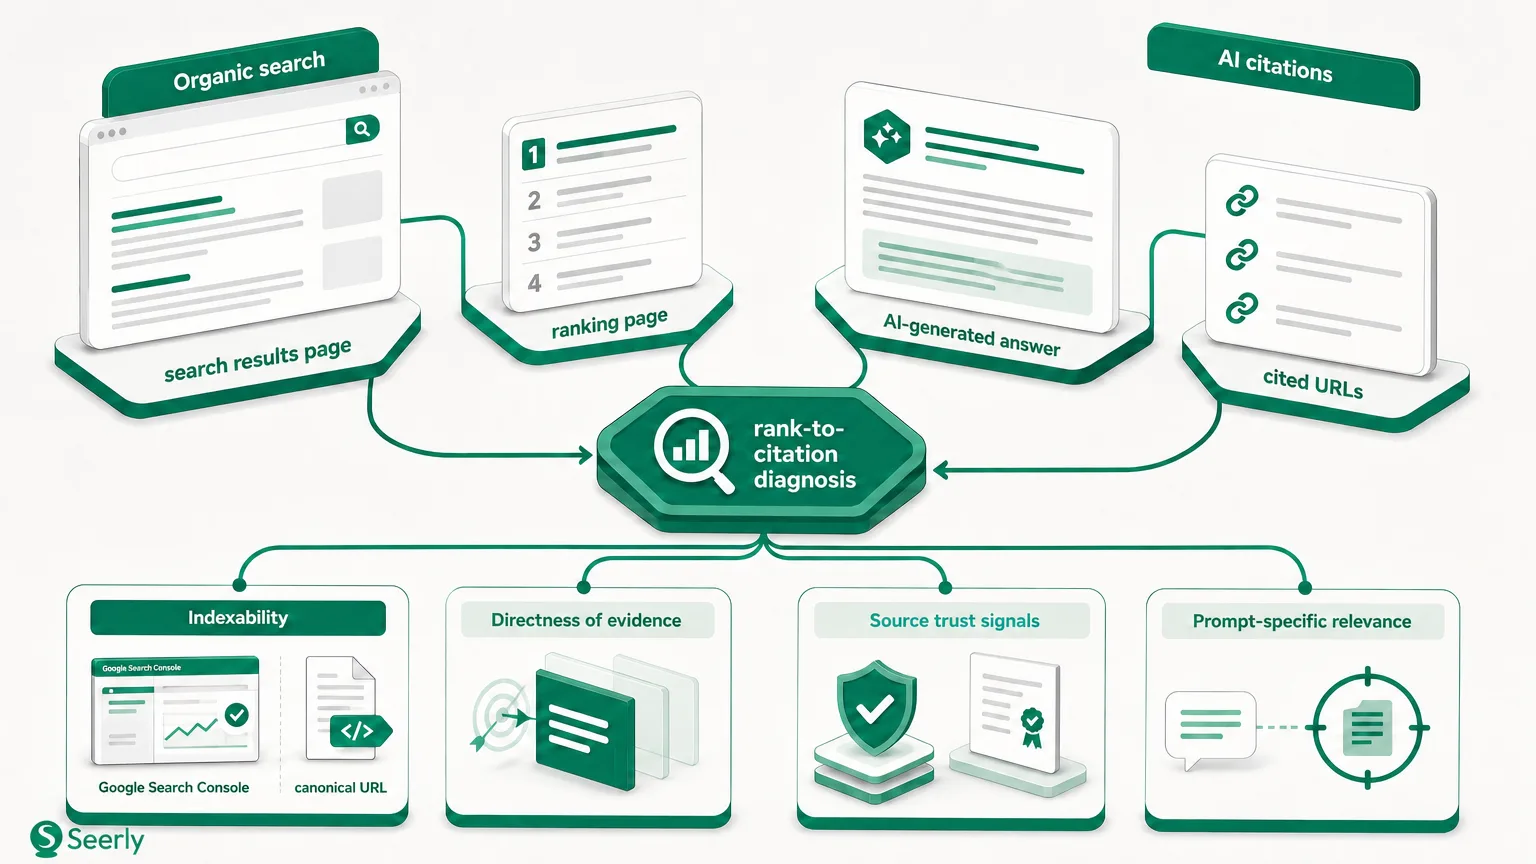
The central lesson is that an AI-answer observation becomes meaningful only when matched with a demand signal and an outcome signal. Use analytics views that connect AI visibility with tracked pages and measurable follow-through alongside Search Console and product or CRM data. For conversion reporting, teams should also establish rules for measuring AI-assisted signups when organic traffic receives the last-click credit, rather than forcing every journey into a single channel label.
What should a monthly AI-era traffic review include?
A useful review is repeatable, evidence-led, and focused on decisions rather than dashboards. Record the following for the query groups that influence your most important traffic and conversion targets:
-
Query segments and demand movement. Document informational, evaluative, branded, and conversion-oriented groups separately. Compare impressions, rankings, clicks, CTR, and query additions or losses so a mix shift does not masquerade as a performance trend.
-
Page groups and audience paths. Map each query group to the pages users land on and the next actions those pages support. Review engagement, assisted conversions, direct conversions, and lead quality to determine whether the visitor value changed alongside traffic volume.
-
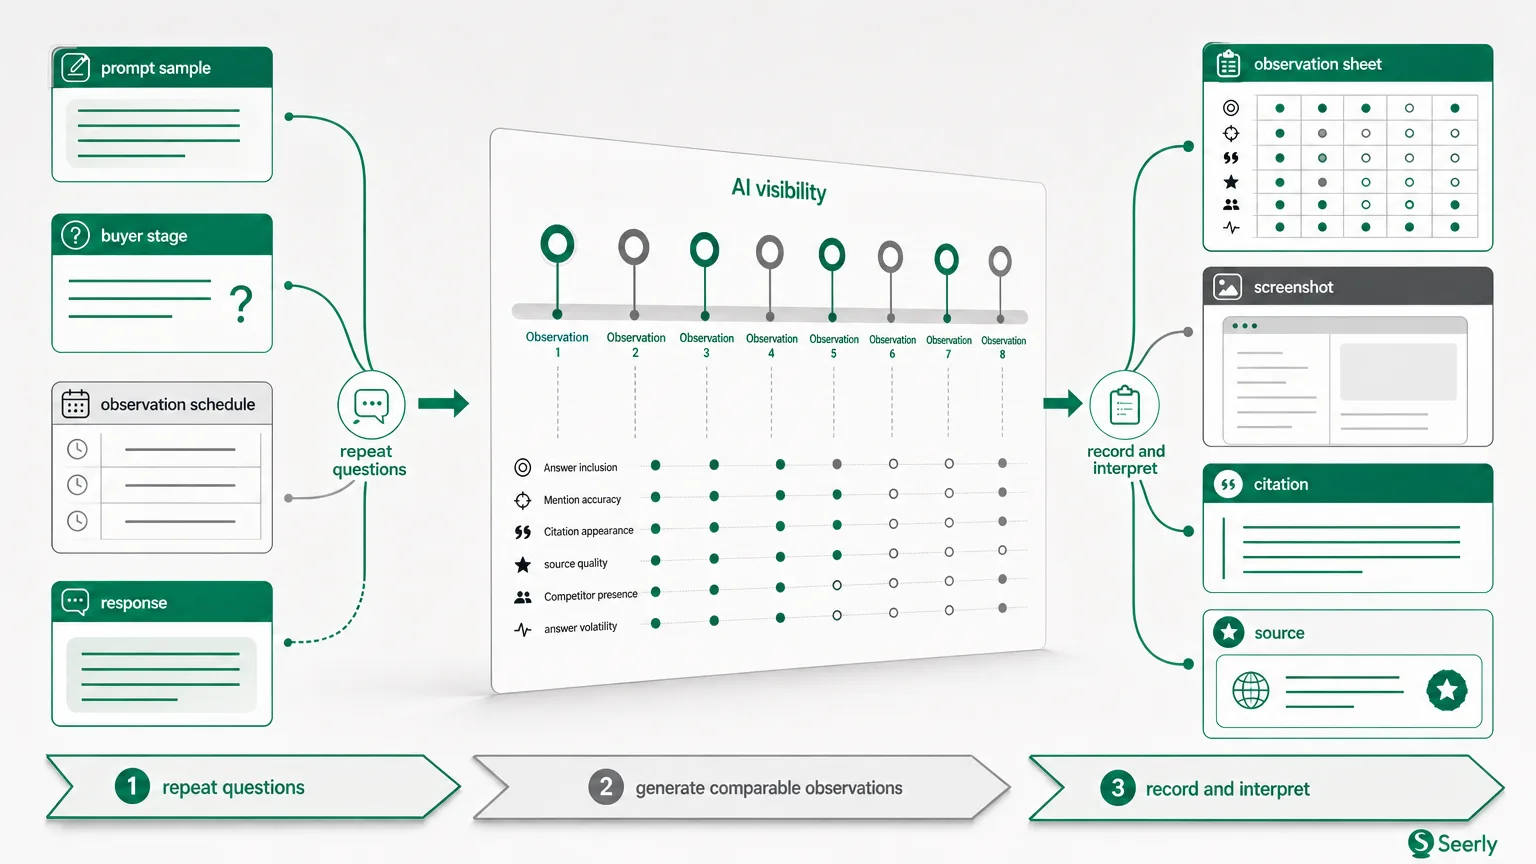
AI-answer observations. Sample priority searches consistently by market, device, and time period. Log whether an AI Overview appears, which sources are cited, whether your brand is represented accurately, and which competitors or publisher types occupy the answer.
-
Citation and visibility benchmarking. Track citation frequency by intent group, not as a sitewide total. Compare your presence with named competitors, then prioritise gaps where the query has commercial relevance and the cited source does not adequately answer the user’s deeper need.
-
Business outcomes and decisions. Close every review with a decision: monitor, investigate technical visibility, improve a page, build a missing asset, correct representation, or reallocate effort. This prevents AI search reporting from becoming an isolated visibility exercise.
Measure the path, not just the click
Headline CTR remains useful as an early warning indicator, but it cannot tell you whether AI Overviews reduced discoverability, improved audience quality, shifted demand, or changed a conversion path. The answer lies in the relationship between query intent, AI-answer presence, citations, landing pages, and business outcomes.
Use Seerly alongside your existing analytics to monitor prompt coverage and AI-answer presence for the query groups behind your most important traffic and conversion decisions. Explore Seerly’s AI search visibility platform to turn those observations into a more complete, decision-ready measurement system.