Page speed triage for AI-ready sites: fix the delays that block dependable discovery
Your homepage scores well, but product pages still take too long to show useful content on mobile. A campaign launch adds another tracking script, and suddenly the lead form feels unresponsive. Meanwhile, different testing tools produce different scores, leaving marketing and engineering teams debating which number to trust.
A page speed test becomes useful when it helps you identify a repeatable problem, locate its cause, and verify a fix. Before expanding AI-search and content-discovery work, teams need dependable access to important pages - not a perfect score on an isolated test. This guide shows how to build a representative test set, prioritize slow templates and critical interactions, and validate improvements without confusing performance gains with guaranteed discovery.
1. Separate performance symptoms from priorities
A slow result is evidence to investigate, not automatically your next engineering task. One unusually slow page may reflect a temporary network condition, while a shared template problem can affect an entire product catalogue. A rendering bottleneck may leave visitors waiting for meaningful content even after the server has responded. A deployment regression requires a different response again: compare releases and consider rollback before starting a broad optimization project.
Start by separating lab measurements from field measurements. PageSpeed Insights provides controlled diagnostic data alongside real-user performance data, where sufficient field data is available. Lab tests help reproduce and explain a problem; field data helps establish whether visitors experience it in practice. Neither a single lab run nor an origin-wide field average should substitute for examining the affected page group.
| Symptom | What distinguishes it | First investigation | Priority signal |
|---|---|---|---|
| One-off slow page | One URL or one run underperforms | Repeat under matching conditions; inspect page-specific assets | Escalate if reproducible or business-critical |
| Template-wide issue | Multiple pages sharing a layout show similar delays | Inspect shared components, assets, and rendering logic | High when important page groups are affected |
| Rendering bottleneck | A response arrives, but useful content appears late | Inspect blocking resources and JavaScript-dependent content | High when primary content or links remain unavailable |
| Deployment regression | Performance deteriorates after a release | Compare release versions, tag changes, and traces | Urgent when a critical journey breaks |
Use Core Web Vitals as diagnostic signals rather than a universal priority ranking. Google's recommended “good” thresholds are Largest Contentful Paint within 2.5 seconds, Interaction to Next Paint below 200 milliseconds, and Cumulative Layout Shift below 0.1. These assess loading, responsiveness, and visual stability, respectively. Field assessment uses the 75th percentile, so an average alone can conceal a substantial group of poorly served visitors.
Rank confirmed problems using four questions:
- Reach: Which templates, URL groups, markets, and devices are affected?
- Business importance: Does the delay interrupt a product evaluation, purchase, lead submission, or essential information journey?
- Recurrence: Does it persist across repeated tests, visits, or releases?
- Content access: Does it delay or prevent access to primary text, navigation, or linked resources?
Treat actual content-access failures and broken critical interactions as escalation conditions. Otherwise, prioritize recurring problems across important templates over small score fluctuations. A crawler that does not execute JavaScript will not experience a browser interaction metric in the same way as a visitor. Keep user-experience evidence separate from evidence about HTTP responses, delivered content, and crawler access.
2. Build a representative page-speed test set
Testing only the homepage creates a misleading picture of site health. Product pages, editorial pages, comparison pages, and campaign landing pages often load different assets and third-party integrations. They may also use different rendering paths or caching rules. Your test set should represent those differences, not simply the URLs that are easiest to remember.
Create a reusable inventory with the following coverage:
- High-value landing pages: Include pages supporting revenue, qualified leads, product evaluation, and major campaigns.
- Key content templates: Sample product, category, article, documentation, comparison, and location templates where relevant.
- Rich-media pages: Include video embeds, interactive demonstrations, large galleries, and image-heavy layouts.
- Mobile journeys: Test important landing pages and the interactions visitors need after arrival.
- Recently changed pages: Cover new components, CMS changes, consent tools, experiments, and tracking deployments.
- Priority markets: Include representative regional pages and test locations relevant to their visitors.
- Control pages: Retain unchanged pages to help distinguish deployment effects from broader variability.
For each shared template, include a typical page and a demanding example. An article with a short text body may behave differently from one with embedded video and several widgets. Similarly, a lightly populated product page may hide problems visible on a richer version. This pairing helps distinguish template-level weaknesses from exceptional content choices.
Choose tools for the question you need answered
Different page speed test tools reveal different parts of the problem. You can run a free page speed test with PageSpeed Insights to review diagnostics and available field data. A Pingdom page speed test examines loading performance and page components, making it useful for investigating resource-loading delays. Browser developer tools complement these reports with request waterfalls, rendering traces, and recordings of actual interactions.
Do not compare tools' headline scores as though they measure identical conditions. Record the tool, test location, device profile, browser, network settings, cache state, and consent state where available. Repeat baseline runs under consistent conditions; three runs can be a practical starting point for spotting variability, not a statistical guarantee. Preserve the individual results rather than reporting only the fastest run.
Every record should contain the test date, URL, device context, page template, release version, and observed issue. Also attach the report or trace, the interaction tested, and whether field data describes the URL or the wider origin. Note campaign and personalization conditions when they change what loads. Without this context, a later “improvement” may simply reflect a different test setup.
3. Diagnose the source of delay
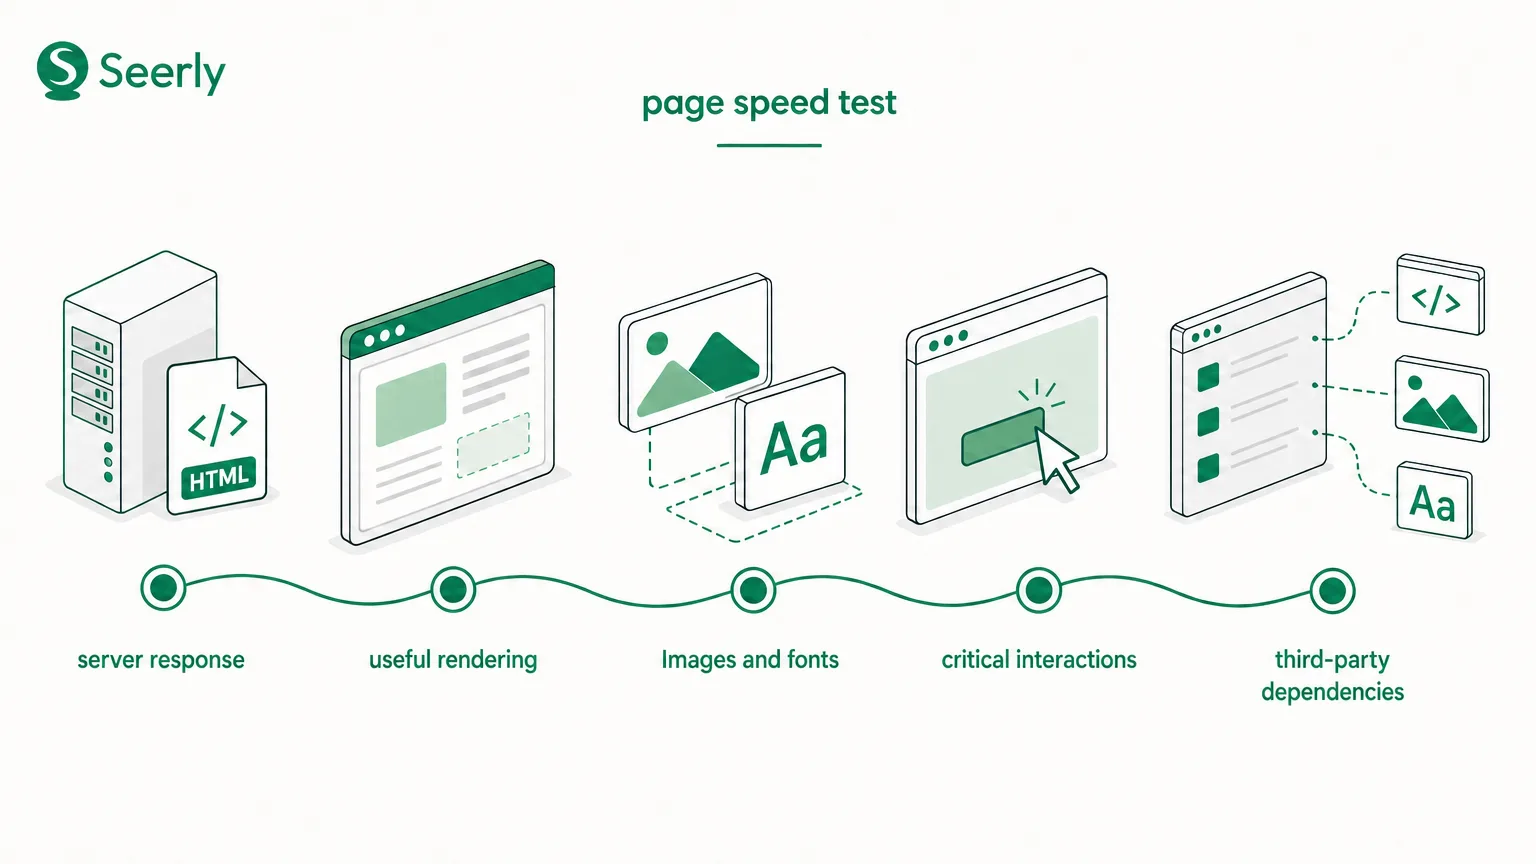
A low performance score does not identify the owner of a problem. Slow server responses, late-discovered images, blocking stylesheets, expensive JavaScript, and third-party requests can produce overlapping symptoms. Follow the delivery sequence to locate where time accumulates. Change one suspected cause at a time when practical, then rerun the same scenario.
Step 1: Inspect server response and document delivery
Start with the main HTML request in the network waterfall. Check redirects, connection timing, waiting time, status codes, and whether the document contains the expected primary content. If waiting dominates before HTML arrives, investigate application processing, upstream services, cache misses, or delivery configuration. A smaller hero image will not resolve time spent waiting for the server.
Time to first byte is useful evidence, but it is not a pure measure of backend computation. It also reflects network and connection conditions, so developers should correlate the browser trace with server logs or application monitoring. Compare cached and uncached requests, and check representative markets. For discovery-related incidents, separately confirm that important URLs return usable content rather than errors or an empty application shell.
Step 2: Identify what prevents useful rendering
Next, inspect when the primary heading, text, navigation, and main visual actually appear. Identify the Largest Contentful Paint element instead of assuming it is always the hero image. PageSpeed Insights explains that LCP measures when the largest visible content element is rendered. A late result can involve delayed server response, resource discovery, download time, or rendering after the resource arrives.
Look for blocking stylesheets, client-side content fetching, and JavaScript work that delays display. Compare delivered HTML with the rendered page to understand whether primary content depends on browser execution. Server rendering can improve initial content availability, but it introduces its own implementation and caching considerations. Frame the requirement as dependable content delivery, not “switch frameworks.”
Step 3: Check images, fonts, and other assets
Inspect image dimensions, formats, transfer sizes, and request timing. Check whether mobile devices receive unnecessarily large files and whether below-the-fold media competes with important resources. Avoid indiscriminate lazy-loading: delaying the principal visible image can worsen loading performance. For fonts, examine unnecessary families and weights, late requests, and layout changes during font replacement.
Use these findings to identify the responsible component or publishing rule. A single oversized upload calls for a page-level correction; repeated oversized images across a template call for automated sizing and editorial safeguards. Font changes also need readability and layout checks, not just a smaller transfer total. Keep the intended visual experience in the acceptance criteria.
Step 4: Record critical interactions
A page can look loaded while still responding poorly to taps and clicks. Record journeys such as opening navigation, selecting a product option, filtering results, and submitting a form. Inspect long main-thread tasks, event handlers, repeated rendering work, and scripts competing during those actions. Google's guidance defines INP as a measure of responsiveness to user interactions, so a load-only test cannot establish that an interaction problem is resolved.
Use controlled interaction recordings to diagnose the cause, then use real-user measurements to assess its prevalence. Keep the tested action consistent across versions. A menu fix does not demonstrate that a checkout or lead form also improved. Scope the conclusion to the interaction and page group actually validated.
Step 5: Isolate third-party dependencies
Inventory analytics, advertising, consent, personalization, chat, and embedded-media code. In a controlled environment, disable suspected dependencies individually and compare network activity and execution time. Check whether they block content or create repeated work after consent or user actions. Distinguish essential functionality from duplicate, unused, or unnecessarily early loading.
Marketing teams should supply the context developers cannot infer from a trace. Explain the page's campaign role, required events, consent requirements, affected audience, and broken action. A useful ticket names the template, release, reproducible delay, suspected dependency, and evidence. “Improve performance” gives developers neither a clear scope nor an acceptance test.
4. Compare fixes by likely impact
The best remediation is not necessarily the one offering the largest projected score increase. A shared image rule may prevent repeated publishing mistakes, while removing a small script may change little for the critical journey. Conversely, a rendering refactor may address a broad problem but carry substantial delivery risk. Compare fixes against the diagnosed bottleneck and the recurrence you want to eliminate.
| Remediation | Affected URLs | Implementation risk | Expected recurrence reduction | Likely owner | Validation method |
|---|---|---|---|---|---|
| Image and font changes | Pages using affected assets or shared rules | Low-medium; visual changes possible | High if sizing and font rules are enforced | Frontend and content teams | Compare asset sizes, LCP, layout, and appearance |
| Script reduction | Pages loading shared bundles | Medium; dependencies may break | High when unnecessary execution is removed centrally | Frontend engineering | Compare traces and critical interactions |
| Tag-governance cleanup | Templates and campaigns using shared tags | Medium; measurement or consent effects | High with ownership and approval controls | Marketing operations and engineering | Test execution, consent, and event collection |
| Rendering improvements | Templates delaying primary content | Medium-high; architecture implications | High when the shared delivery path changes | Web engineering | Compare HTML, rendering traces, and content availability |
| Caching improvements | Cacheable pages and resources | Medium; stale or personalized responses possible | High for repeated delivery delays | Platform or backend engineering | Check response timing, cache behavior, and freshness |
| Template refactoring | All pages using the affected template | High; broad functional and visual exposure | High when structural causes are removed | Web team and design systems | Run cross-template performance and functional checks |
These are planning assessments, not measured promises. Estimate expected impact from the trace: reducing image bytes has limited value if server waiting dominates the delay. Likewise, caching needs explicit rules for personalized content and freshness. Write down the expected mechanism before implementation so the team can test whether that mechanism changed.
When two fixes offer similar benefits, prefer the one that removes the recurring cause with lower implementation risk. An automated image pipeline is generally more sustainable than repeatedly replacing individual uploads. Shared tag controls can also prevent future campaigns from reintroducing unnecessary dependencies. Use a severity-ranked audit workflow to distinguish site-wide patterns from page-level issues, then attach performance evidence to the prioritized work.
5. Verify the release and monitor for regression
A better score after deployment is encouraging, but insufficient by itself. The comparison needs matching test conditions and evidence that the targeted delay improved. It must also show that functionality, measurement, accessibility, and content delivery remain intact. Define those acceptance conditions before the release rather than negotiating them afterward.
Use this launch checklist:
- Preserve before-and-after records: Keep reports, traces, timestamps, release identifiers, and test settings.
- Repeat representative mobile checks: Reproduce important loading and interaction scenarios under comparable conditions.
- Validate affected templates: Test typical and demanding pages, not only the URL used during development.
- Confirm the mechanism: Verify that the targeted waiting time, resource delay, or execution work actually decreased.
- Check content access: Confirm expected responses, primary content, navigation, and essential linked resources.
- Document trade-offs: Record changes to visual quality, freshness, personalization, tracking, or accessibility.
- Check unaffected controls: Look for problems introduced elsewhere by shared code or configuration changes.
- Assign recurring checks: Retest after template releases, rich-media updates, consent changes, and tag deployments.
Separate immediate release validation from field confirmation. PageSpeed Insights field data covers a rolling 28-day collection period, so it will not instantly represent only the new release. Use controlled tests for immediate comparisons and real-user monitoring, where available, for release-specific observation. Then review field trends as the updated experience accumulates.
A useful release note states what changed, which templates were tested, which delays improved, and what remains uncertain. It should also name an owner for future checks and define when deterioration warrants investigation. Avoid alerts based solely on minor score movement; investigate persistent changes in the metrics and journeys that matter. Performance monitoring is most valuable when it catches recurrence before the next campaign or content expansion amplifies it.
Make performance part of the readiness workflow
Start performance work with slow shared templates and user-critical interactions, not isolated lab-score fluctuations. Use repeatable tests to locate the delay, choose a remedy that addresses its cause, and verify the release under comparable conditions. Better page speed supports dependable access and a stronger user experience. It does not prove AI-answer inclusion or citation, which must be assessed separately.
Run a structured readiness review in Foundations > Smart Audit and document prioritized template issues with owners, evidence, and acceptance criteria. For an individual page or draft, use a page-level readiness check to review severity-ranked recommendations and specific fixes. Then use Foundations > Web Presence to keep performance risks visible alongside content and discovery work. The next step is not another isolated score - it is a measurable, accountable improvement to an important page group.