How to check website traffic before rewriting your AI search strategy
An unexpected rise or fall in traffic creates pressure to act quickly: pause campaigns, rewrite pages, change budgets, or overhaul an AI-search plan. That pressure is understandable, but it is also how teams mistake a tracking defect or a short-lived referral spike for a strategic problem. The first job when you check website traffic is not to explain the change - it is to preserve the evidence needed to explain it reliably.
What should we preserve before investigating a traffic anomaly?
Start by creating a time-stamped baseline before changing filters, channel groupings, dashboards, or tracking settings. If you alter the reporting environment while investigating, you can lose the ability to reproduce what stakeholders originally saw. Capture the anomaly in both a short comparison window, such as the last seven days versus the prior seven, and a longer context window, such as 28 or 90 days.
Use this baseline-capture checklist:
-
Record the exact dates and time zone. Note whether you are comparing complete days, partial days, weeks beginning on different weekdays, or periods affected by holidays and launches. A Monday-to-Monday comparison is generally more useful than comparing arbitrary date ranges with different day-of-week mixes.
-
Save the original dashboard view. Export total users, sessions, engaged sessions, conversions, revenue or leads, and channel-level figures. Include the report’s filters, comparison period, attribution setting, property, and data stream.
-
Document channel definitions. “Organic,” “direct,” and “referral” can change when UTM rules, channel-group definitions, or self-referrals change. Preserve the channel report alongside source/medium and landing-page reports so you can identify classification changes.
-
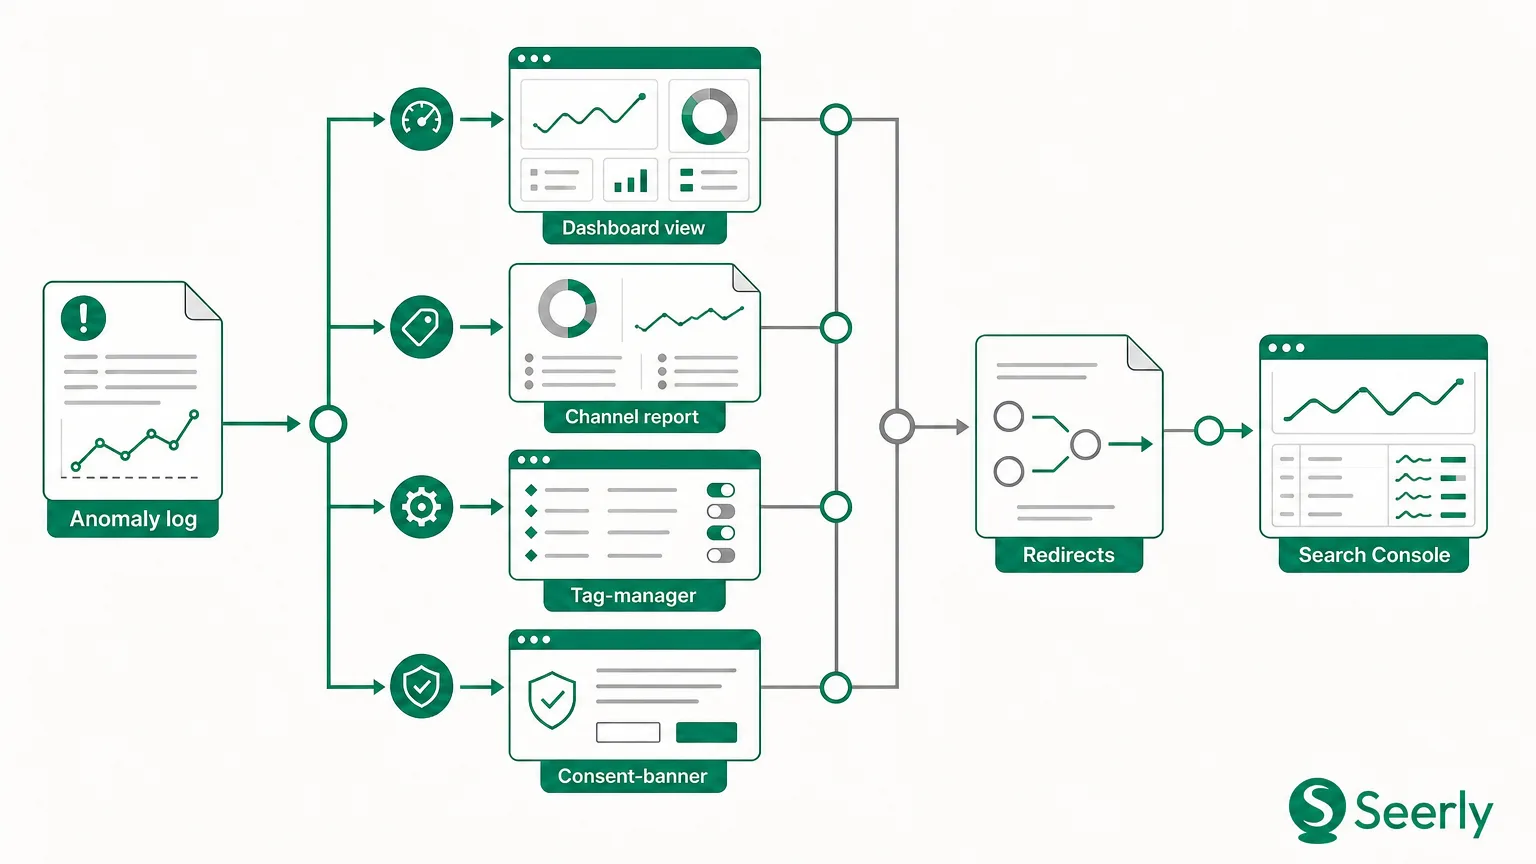
Add operational annotations. List deployment dates, consent-banner updates, tag-manager publishes, redirects, CMS releases, campaign launches, PR coverage, email sends, and downtime. Also note whether a migration, domain change, or robots.txt update occurred.
-
Capture search and AI-discovery context. Export Search Console clicks, impressions, queries, pages, and country/device splits. Then record monitored prompts, brand mentions, and citation appearances that might indicate a change in AI search visibility.
This initial record becomes your anomaly log. It also makes later review more credible because stakeholders can see what was known at the time, rather than a retrospective explanation built after the data changed.
Could the movement be a measurement or implementation issue?
Before interpreting a traffic decline as lost demand, test whether the measurement pipeline changed. This is especially important when the movement is abrupt, affects several channels at once, or appears only in one reporting tool.
Use this diagnostic decision tree
Did the movement begin on a specific date or hour? If yes, compare it with deployment, tag-manager, consent-platform, and redirect logs. A sharp step change immediately after a release is stronger implementation evidence than a gradual weekly decline.
Did all channels move in the same direction? If every channel fell at once, check whether the analytics tag fires, whether the correct measurement ID is present, and whether a consent setting changed data collection. If only one channel moved, continue with source-level diagnosis rather than assuming a sitewide tracking failure.
Did the site redirect, change domains, or alter templates? Test key landing pages in a browser and inspect whether redirects preserve query parameters and UTM tags. Broken redirects can remove campaign attribution, while cross-domain or payment-provider journeys can create self-referrals.
Did tracking tags or consent behavior change? Review tag-manager version history, consent-banner release notes, and browser tests with consent accepted and declined. A lower observed user count may reflect a change in measurable consented traffic rather than an equivalent fall in real visits.
Is the newest data complete? Avoid calling an anomaly from a same-day dashboard snapshot. Google Analytics documents that reporting can have different freshness expectations depending on the report and property setup, so confirm that the affected dates have finished processing before escalating.
Finally, check for invalid or automated activity. Automated traffic is not a minor edge case: Imperva reported that bots accounted for 49.6% of internet traffic in 2023. That does not mean half of your analytics sessions are bots, but it does justify reviewing suspicious sources, engagement patterns, server logs, and sudden spikes from unusual geographies before celebrating a traffic increase.
Which acquisition sources changed, and how meaningful is each change?
After validating measurement, break the headline number into acquisition sources. Do not rely on one channel chart: compare users, sessions, engaged sessions, conversions, and landing pages.
Worked example: a 22% traffic increase
Imagine a B2B software site records 12,200 sessions this week, up from 10,000 last week. The 2,200-session increase looks meaningful, but the channel breakdown changes the conclusion:
| Channel | Previous sessions | Current sessions | Change | Investigation signal |
|---|---|---|---|---|
| Direct | 2,800 | 3,500 | +700 | Check untagged email, apps, redirects, and brand demand |
| Referral | 900 | 1,850 | +950 | Identify referring domains and engagement quality |
| Organic search | 4,700 | 4,900 | +200 | Check queries, rankings, and landing pages |
| Paid campaign | 1,600 | 1,950 | +350 | Compare spend, targeting, and UTMs |
The increase is real in aggregate, but no single story explains it. Referral contributed the largest share of growth, while direct traffic also rose enough to warrant checking whether a newsletter, podcast mention, or tracking change caused traffic to be unattributed. Organic search grew only modestly, so rewriting SEO content would be premature.
Check whether the referral sessions engaged or converted. If 950 new referral sessions have a 95% bounce rate, zero conversions, and one unfamiliar host, treat the spike as a quality or filtering investigation, not as proof of new audience demand. If they land on a useful resource and later convert, investigate the referring placement and consider a partnership response.
External estimates can help with competitor context, but they cannot replace first-party analytics. Semrush states that its traffic figures are estimates rather than a company’s actual analytics data, while Similarweb’s rank is a relative estimate based on traffic and engagement signals. Use these tools to form hypotheses, not to validate the cause of your own anomaly.
Did branded demand, search-query behavior or page performance change at the same time?
Now compare search evidence with the same dates. Search Console helps reveal whether Google search demand, query visibility, or page-level performance moved alongside analytics traffic.
| Evidence to compare | What to look for | Likely interpretation |
|---|---|---|
| Branded queries | Impressions and clicks for brand terms | Demand, publicity, or awareness may have changed |
| Non-branded queries | Topic clusters gaining or losing impressions | Search visibility or demand may have shifted |
| Landing pages | Pages responsible for session and click movement | A page-level issue may be hidden in sitewide totals |
| Search position and CTR | Position decline, CTR decline, or both | Ranking, snippet appeal, or SERP-layout changes may differ |
| Content-release dates | Publication, refresh, removal, or canonical change | Content changes may be related, but not automatically causal |
How can teams investigate whether AI discovery is part of the picture?
AI discovery should be investigated as an evidence layer beside - not instead of - analytics and search data. A user may see a brand in an AI-generated answer, later search for the brand, visit directly, or arrive through an untracked app environment. That makes attribution incomplete, but it does not make it unmeasurable.
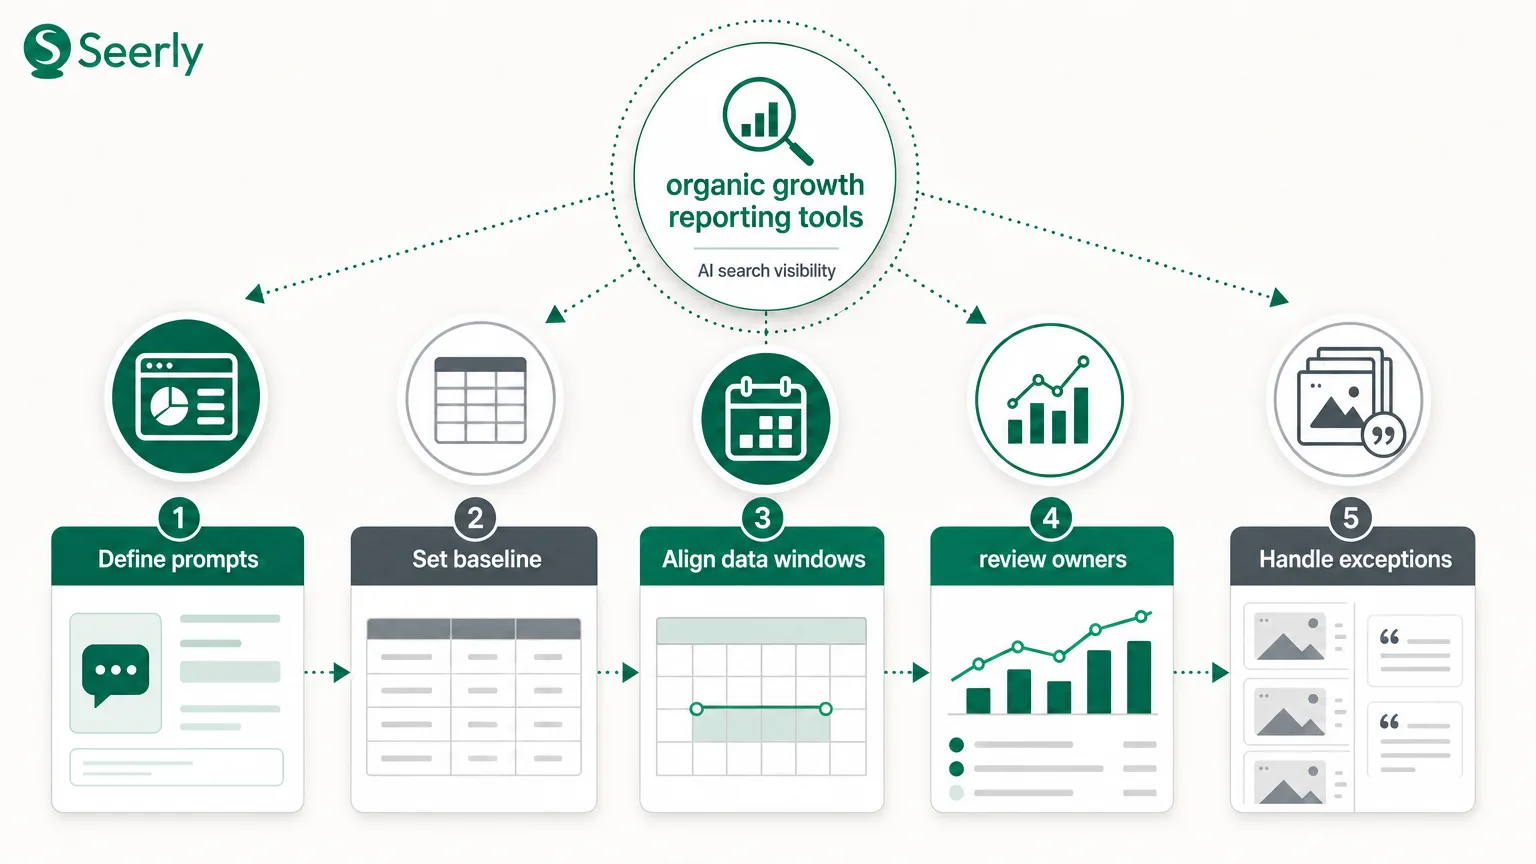
Build an AI-discovery review in five steps
-
Freeze a prompt set. Use the buyer questions, comparison prompts, category searches, and problem statements most relevant to your market. Record the exact wording, locale, language, platform, and date because answers can vary across contexts.
-
Compare prompt performance over time. Track whether your brand is mentioned, how it is described, which competitors appear, and whether the answer links to your domain. Treat changes as observations to validate, not automatic proof that AI caused a traffic shift.
-
Capture citation evidence. Save cited URLs, page types, source quality, and whether the citation supports an accurate brand claim. This connects generative engine optimisation to practical website improvements: strengthen pages that are useful, factual, and easy for systems to reference.
-
Match timing with conventional signals. Review branded search, direct traffic, referral domains, landing-page visits, and conversions around the same period. A simultaneous lift across several signals is more credible than a single AI mention viewed in isolation.
-
Benchmark competitors and monitor sentiment. If a competitor gains citations for high-value prompts while your mention rate falls, that is a visibility hypothesis worth testing. It is not, by itself, a reason to rewrite every page or abandon established search strategy.
A durable reporting model should keep AI visibility and organic performance distinct while making them comparable. Seerly’s approach to reconciling AI visibility, organic traffic, and SEO data can help teams frame that review around evidence rather than a single vanity metric.
When is there enough evidence to act?
Act when at least two independent signals support the same explanation and the proposed response fits the likely cause. For example, a tag failure confirmed by browser testing and a simultaneous all-channel fall is enough to fix immediately.
Use this prioritisation checklist:
- Fix when you have confirmed tracking, consent, redirect, indexing, or tagging defects.
- Monitor when the movement is small, recent, seasonal, or unsupported by a second evidence source.
- Test when a plausible hypothesis exists but causation is uncertain, such as improving a cited page, refining campaign UTMs, or testing a title change on one page group.
- Escalate when high-value conversions fall, a migration affects critical pages, brand sentiment changes materially, or multiple trusted sources show sustained visibility loss.
FAQ: How do we avoid changing strategy too early?
Should we pause paid spend after a traffic drop?
Not solely because total sessions declined. First determine whether paid sessions, spend, impressions, click-through rate, and conversion quality changed together. If paid traffic is stable but total traffic fell because of referrals or tracking, pausing budget addresses the wrong problem.
Can we check website traffic free of paid tools?
Yes. Google Analytics, Search Console, server logs, tag-manager history, campaign records, and browser testing provide a strong first-party diagnostic foundation. Free tools are most useful when you use consistent date ranges and document definitions before comparing reports.
Should we check website traffic ranking every day?
Daily rank checks can reveal acute issues, but they can also encourage overreaction to normal variation. Review ranking alongside clicks, impressions, landing pages, and query intent, especially when the business question is whether a change affected qualified demand rather than one keyword position.
Build an anomaly log before changing the plan
When you check website traffic online, the useful outcome is not a faster explanation - it is a defensible one. Preserve the baseline, rule out measurement issues, isolate channel changes, compare search evidence, and assess AI-discovery signals alongside referral and demand data.
Create an anomaly log that links dates, dashboard exports, releases, prompt performance, brand mentions, citations, and the decision taken. Then use Seerly to maintain the AI-visibility evidence layer over time, so future traffic changes can be evaluated against monitored prompts, competitive visibility, and brand-citation evidence rather than assumptions.