AI crawler traffic monitoring: build one baseline from logs, crawl data and referrals
Your crawler dashboard drops after a security update, but nobody knows whether AI systems stopped requesting content or simply stopped reaching the server. Marketing sees fewer AI referrals, SEO sees a different pattern in Search Console, and web operations sees more blocked requests. Each team has evidence, yet the charts appear to contradict one another.
AI crawler traffic monitoring becomes useful when those observations form a reconciled evidence model - not when they are added into one traffic total. Requests, security decisions, origin responses, crawl reports and referral visits describe different events. This guide explains how to connect them into a baseline that distinguishes access failures, measurement changes and genuinely lower observed crawl activity without claiming more than the data supports.
Why a falling traffic chart cannot diagnose crawler demand
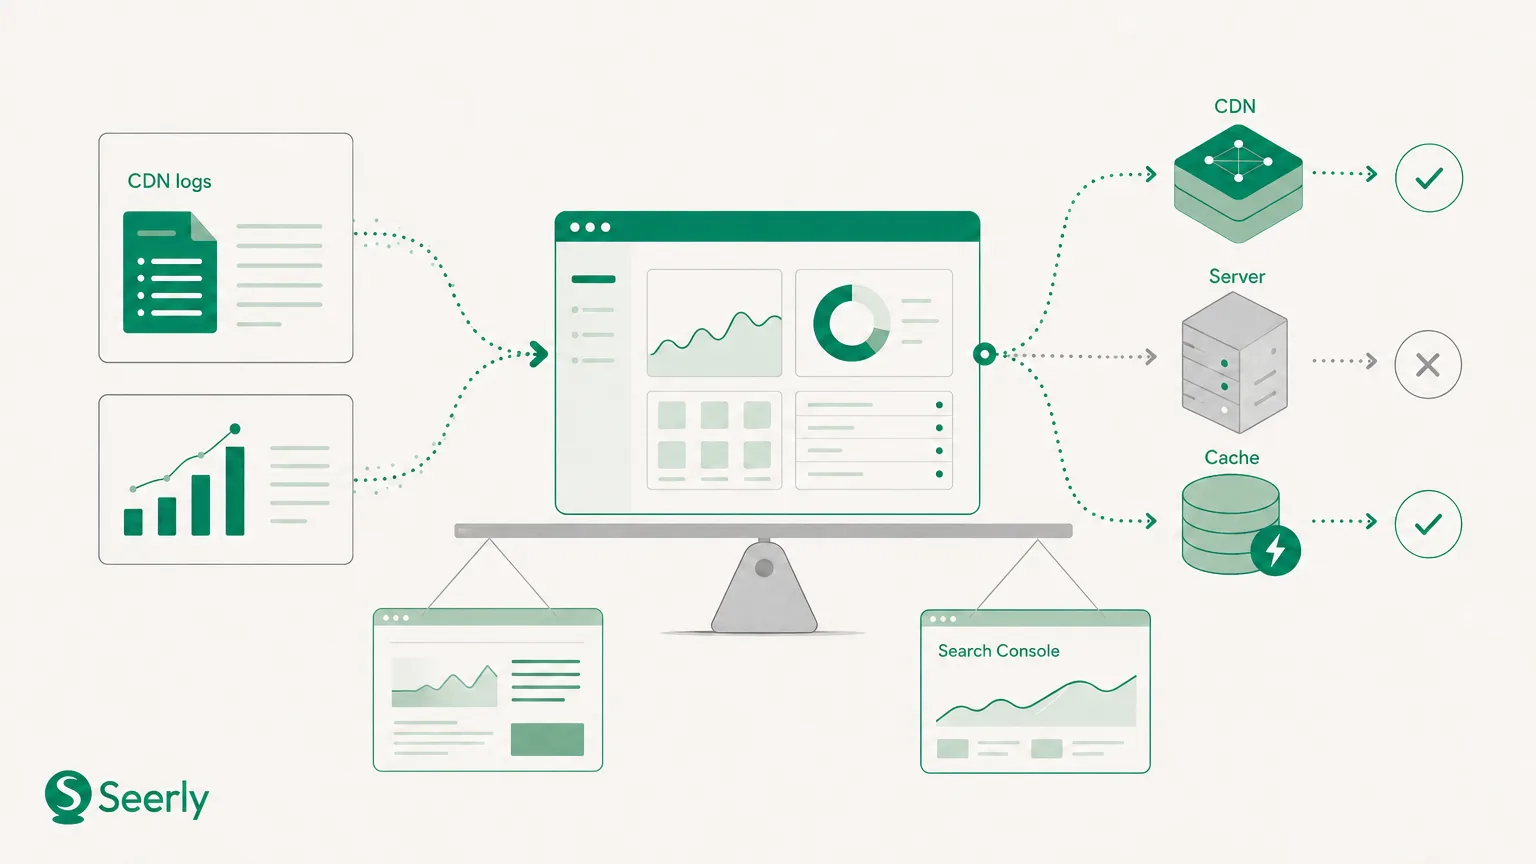
Consider a hypothetical deployment that introduces a stricter web application firewall rule. Requests from an AI crawler continue arriving at the CDN, but more are blocked before reaching the origin. Server logs now show fewer crawler requests even though observed arrivals at the edge have not declined. Calling that change “lower AI interest” would mistake an access restriction for a demand signal.
Caching can produce another version of the same mismatch. If more requests are served from the CDN cache, origin traffic can fall while successful content delivery remains stable. A changed bot-classification rule, missing log export or altered analytics filter can also move a chart without changing crawler behavior. The first investigation question should therefore be: what does this chart count, and where is that event observed?
Referral visits introduce a separate measurement boundary. A crawler fetching a page and a person clicking through from an AI answer are not interchangeable events, and a visit does not identify the crawl that influenced an answer. Keep access, observed crawling, answer visibility and referral behavior as related but distinct measures. Otherwise, a technical incident can become an unsupported claim about lost visibility.
What the four evidence streams can prove
Assign each source a specific evidentiary role before comparing totals. CDN logs describe requests at the perimeter; origin logs describe requests that reached the application infrastructure. Crawl reporting provides an operator-specific view, while referral reporting captures attributable inbound activity. Their value comes from explaining differences, not forcing agreement.
| Evidence stream | What it can establish | What it cannot establish alone | Main reconciliation concern |
|---|---|---|---|
| CDN/WAF logs | Recorded edge arrivals, security actions, cache outcomes and edge responses | Whether every allowed request reached the origin or led to later citation | Sampling, classification changes and incomplete exports |
| Origin/server logs | Requests reaching the server, application responses and processing failures | Requests blocked upstream or served entirely from cache | Counting the origin observation as a second visit |
| Crawl reporting, including Search Console | The reporting operator’s view of crawl activity and reported issues | Activity across unrelated AI operators or complete request-level attribution | Different scope, aggregation and reporting delays |
| AI referral data | Requests, sessions or conversions attributed to recognized AI referrers, depending on the tool | Total AI answer exposure, unclicked citations or the responsible crawl | Missing attribution and inconsistent counting units |
Google explicitly warns that client-side analytics may not provide a full or accurate representation of Googlebot and Web Rendering Service activity and recommends Crawl Stats for monitoring them. That makes Search Console a useful Google-specific cross-check, not a universal AI-crawler counter. Preserve its reporting scope instead of trying to match every aggregate to an edge-log total. Differences should be annotated before they are interpreted.
Identification also needs an evidence standard. Cloudflare describes verified-bot identification using validation methods beyond a user-agent label, reinforcing why a familiar user-agent string should not automatically count as confirmed identity. Store whether identification is verified, provider-classified, user-agent-only or unknown. A change in confidence can otherwise masquerade as a change in crawler volume.
Build a comparable baseline step by step
1. Define scope and crawler identity
Start with a shared measurement contract covering hostnames, environments, time zone, request types, data owners and collection coverage. Separate production HTML pages from assets, APIs, staging hosts and monitoring probes. Preserve raw fields alongside normalized fields so that classification decisions can be audited later.
Create a versioned crawler registry with operator, agent or control token, documented purpose, verification method and classification date. Do not collapse every agent from one company into a single undifferentiated category. Use an AI crawler directory to distinguish agents and robots.txt controls, then retain operator-level and agent-level views. This prevents a shift between crawler purposes from looking like a company-wide decline.
2. Use edge requests as the arrival baseline where coverage permits
For a site consistently routed through a logged CDN, use unique observed edge requests as the primary arrival count. Attach security, cache and origin evidence to those arrivals rather than adding those observations together. If some traffic bypasses the CDN, document that route separately and explain how it enters the baseline.
Maintain separate fields for identity, security action, delivery route and response outcome. An “allowed” request has passed an access decision; it has not necessarily received usable content. Cloudflare’s documentation lists total, allowed, unsuccessful and referral requests among its AI-traffic metrics, with crawler activity grouped by operator. These are useful reporting dimensions, but teams should preserve the provider’s definitions rather than assume they are mutually exclusive buckets.
A practical request record should distinguish:
- Security action: allowed, blocked, challenged or otherwise restricted.
- Delivery route: cache-served, origin-served or unresolved.
- Response: edge status, origin status where available, and network or timeout errors.
- Identity: operator, agent, confidence level and classification version.
3. Segment paths and response codes
Group requests into meaningful page families such as product pages, documentation, pricing and editorial content. Keep the exact requested URL available, including query parameters when they affect the resource. Separately map URLs to reporting groups, so normalization does not erase distinct requests or hide redirect problems.
Retain status-code detail rather than treating every non-success response as a block. A redirect, missing page, rate limit and application error require different investigations. Also inspect selected successful responses for challenge pages or incorrect content. A 200 response is evidence of a response, not proof that the intended page was delivered.
4. Normalize reporting periods and coverage
Choose a shared reporting time zone and compare complete intervals. Track collection time separately from event time, and mark ingestion delays, missing partitions, sampling and retention changes. Exclude incomplete periods from automated comparisons or label them clearly as provisional.
Use matched weekdays and comparable windows when establishing normal variation. As an initial operating choice, several complete weeks may be more useful than yesterday alone, but the appropriate window depends on crawl frequency and site changes. Search Console aggregates should remain in their native reporting context where exact alignment is unavailable. Do not manufacture hourly precision from daily or delayed data.
5. Deduplicate observations, not legitimate requests
Where possible, propagate a request identifier from the edge to the origin and join on that identifier. Remove repeated exports of the same source event, then attach matching origin records to the edge record. Keep origin retries as child attempts where the infrastructure exposes them, rather than counting them as additional incoming crawler requests.
Without shared identifiers, use cautious matching based on timestamps, host, method, path and available connection metadata. Record ambiguous or unmatched observations instead of forcing a join. Do not deduplicate simply because the same crawler requested the same URL twice: those may be genuine separate attempts. Search Console aggregates and referral sessions should stay outside this request-level deduplication process.
6. Keep referral behavior in a parallel ledger
Choose whether referral reporting measures requests, sessions, users or conversions, and label that unit everywhere. Maintain a versioned list of recognized AI referrers and record changes to analytics filters, consent handling and attribution rules. CDN referral requests and analytics sessions should not be silently substituted for one another.
Connect referrals to landing-page groups and reporting periods, not to an assumed originating crawl. Missing referrer information should remain unattributed unless independent evidence supports classification. The reconciled baseline is therefore a set of connected views: observed arrivals, access decisions, delivery outcomes, operator reports and attributable visits.
Set alerts that lead to a diagnosis
Alert thresholds should reflect each segment’s normal volume and variability. Percentage changes are unstable for low-volume crawlers, while sitewide totals can conceal failures on important pages. Combine relative movement, an absolute-volume requirement and persistence across complete windows. Treat threshold values as operating choices to test, not industry benchmarks.
For example, a team might begin with a review alert when arrivals fall more than 30% across two comparable complete windows, provided the segment normally has enough requests to make that meaningful. A rise in blocks on priority pages may deserve faster escalation even when total traffic barely changes. Review alert noise after implementation and adjust thresholds using observed distributions.
Use this diagnostic sequence:
- Validate measurement. Are exports complete, filters unchanged and classifications consistent?
- Compare edge arrivals. Did recorded requests fall, or only downstream observations?
- Inspect access decisions. Did blocks, challenges or rate limits increase?
- Inspect delivery. Did cache behavior, origin errors, timeouts or redirects change?
- Check site changes. Review robots.txt, URL migrations, authentication and deployment history.
- Assess remaining explanations. Only then consider lower observed crawl demand.
The resulting decision tree should remain explicit:
Is collection complete and comparable?
├─ No → Investigate measurement; defer demand conclusions.
└─ Yes
   ├─ Edge arrivals stable, origin requests down
   │  ├─ Restrictions increased → Access issue is supported.
   │  ├─ Cache serving increased → Delivery-route change is supported.
   │  └─ Neither → Investigate routing and log joins.
   └─ Edge arrivals down
      ├─ Delivery failures or access-policy changes present
      │  → Fix or explain those conditions first.
      └─ No identified access or measurement issue
         → Lower observed crawl activity is plausible;
           operator intent and visibility remain unproven.
A restriction can also affect subsequent request patterns, so access problems and lower arrivals are not mutually exclusive. Preserve the incident timeline when interpreting later declines. Describe the conclusion at the level the evidence supports: “fewer observed requests” is stronger than an unverified claim that an operator has lost interest in the site.
Document an incident without inventing a visibility outcome
The following is an illustrative incident record, not a customer case study or measured result. It shows how one investigation can separate several mechanisms that initially appeared as a single crawler decline. In practice, attach saved queries, request samples and configuration changes to each finding. Keep unresolved questions visible rather than turning them into confident explanations.
| Incident field | Illustrative entry |
|---|---|
| Trigger | Origin-observed crawler traffic declined after a deployment |
| Scope | Production product and documentation pages, segmented by agent |
| Measurement check | Edge exports complete; classifier unchanged; origin export gap identified |
| Access evidence | A new WAF rule challenged requests to a product-page group |
| Delivery evidence | Separate allowed requests reached the origin but returned application errors |
| Demand evidence | Another agent showed fewer edge arrivals across complete matched windows |
| Interpretation | Access restrictions and origin failures are supported; lower observed activity remains a separate finding |
| Visibility conclusion | No established change in answer inclusion, citations or attributable visits |
| Owners | Web operations: WAF; engineering: application errors; analytics: export repair; SEO: follow-up |
| Closure criteria | Validate intended access, delivery, collection and subsequent crawl patterns |
The blocked or challenged group needs a policy review, not an immediate assumption that every crawler should be allowed. The origin-error group needs application remediation because passing the WAF did not guarantee successful delivery. The export gap requires data repair before trend comparisons resume. The remaining decline can be monitored as lower observed activity without assigning an unsupported motive to the operator.
Closure should be defined separately from traffic recovery. A technical fix is validated when the intended access policy and delivery behavior work under appropriate checks and subsequent evidence. Request volume may not immediately return, and visibility may follow a different pattern. Record those outcomes independently instead of making an operational team responsible for proving a citation gain.
Use a monthly report that connects evidence to priority pages
A recurring report should tell stakeholders what changed, how reliable the finding is and what action follows. Lead with coverage and exceptions before interpreting trends. Show priority-page segments alongside sitewide totals so that high-volume, low-value paths do not dominate the discussion. Use the same definitions across months, and disclose revisions when those definitions change.
| Report component | What to include |
|---|---|
| Scope and reliability | Hosts, dates, time zone, completeness, sampling and classification changes |
| Crawler activity | Unique edge arrivals by operator and agent; verification confidence |
| Access and delivery | Restrictions, cache serving, origin responses, failures and unmatched observations |
| Priority pages | Page groups affected, intended access policy and unresolved technical issues |
| Crawl-report context | Operator-specific trends, reporting lag and scope differences |
| AI referrals | Counting unit, landing pages, attribution limitations and conversions where measured |
| Prompt monitoring | Fixed prompt set, engine, test date, brand inclusion and cited-page observations |
| Actions | Finding, evidence, confidence, owner, deadline and validation method |
Keep prompt monitoring alongside the crawl baseline rather than treating it as a derivative of request volume. Compare a consistent set of priority questions and record changes to engines, testing conditions and target pages. A page can have healthy access without appearing in a tested answer, while an answer may cite content without producing a referral visit. Each observation answers a different business question.
Use Seerly to track priority prompts and review how your brand appears across AI engines alongside the reconciled crawler baseline. Route supported findings - such as unintended restrictions, broken responses or inaccessible priority pages - into an AI-readiness remediation plan with owners and validation criteria. The objective is not one chart that appears definitive. It is a reliable chain of evidence that tells teams what to fix, what to monitor and what they still cannot conclude.